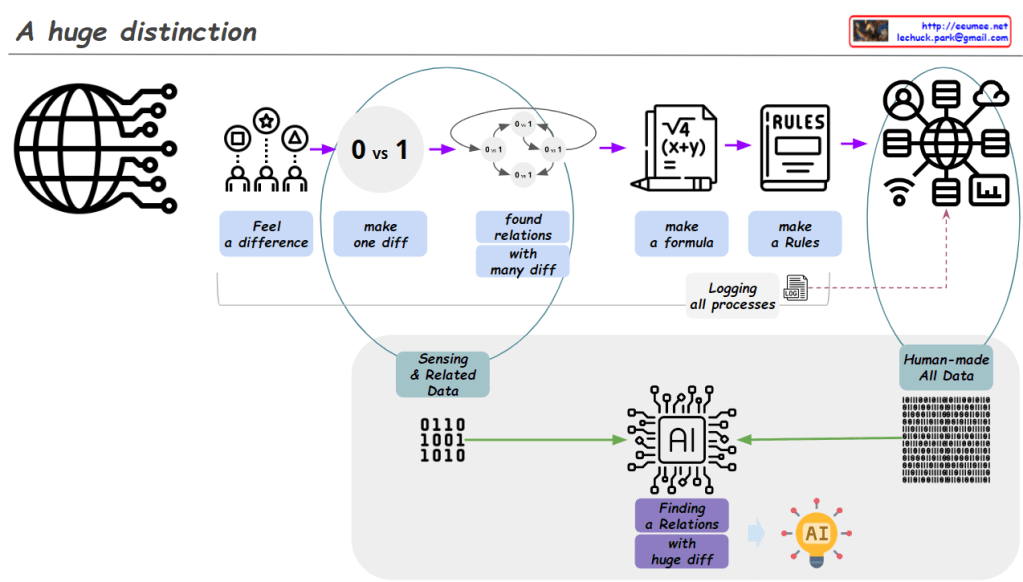
From Claude with some prompting
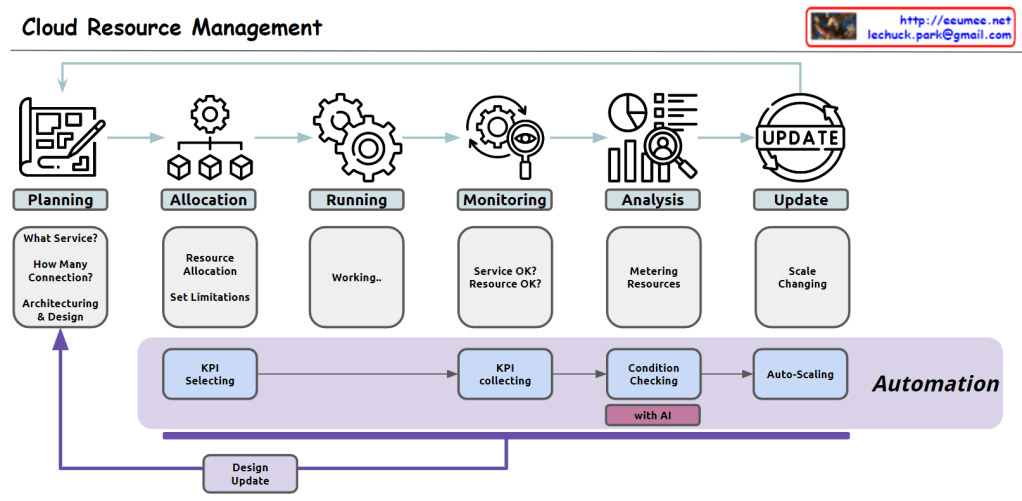
Here’s the comprehensive overview of cloud resource management in English:
- Planning:
- Service selection: Determining appropriate cloud computing service types (e.g., virtual machines, containers, serverless)
- Capacity forecasting: Estimating required resource scale based on expected traffic and workload
- Architecture design: Designing system structure considering scalability, availability, and security
- Infrastructure definition tool selection: Choosing tools for defining and managing infrastructure as code
- Allocation:
- Resource provisioning: Creating and configuring necessary cloud resources using defined infrastructure code
- Resource limitation setup: Configuring usage limits for CPU, memory, storage, network bandwidth, etc.
- Access control configuration: Building a granular permission management system based on users, groups, and roles
- Running:
- Application deployment management: Deploying and managing services through container orchestration tools
- Automated deployment pipeline operation: Automating the process from code changes to production environment reflection
- Monitoring:
- Real-time performance monitoring: Continuous collection and visualization of system and application performance metrics
- Log management: Operating a centralized log collection, storage, and analysis system
- Alert system setup: Configuring a system to send immediate notifications when performance metrics exceed thresholds
- Analysis:
- Resource usage tracking: Analyzing cloud resource usage patterns and efficiency
- Cost optimization analysis: Evaluating cost-effectiveness relative to resource usage and identifying areas for improvement
- Performance bottleneck analysis: Identifying causes of application performance degradation and optimization points
- Update:
- Dynamic resource adjustment: Implementing automatic scaling mechanisms based on demand changes
- Zero-downtime update strategy: Applying methodologies for deploying new versions without service interruption
- Security and patch management: Building automated processes for regularly checking and patching system vulnerabilities
Automation process:
- Key Performance Indicator (KPI) definition: Selecting key metrics reflecting system performance and business goals
- Data collection: Establishing a real-time data collection system for selected KPIs
- Intelligent analysis: Detecting anomalies and predicting future demand based on collected data
- Automatic optimization: Implementing a system to automatically adjust resource allocation based on analysis results
This approach enables efficient management of cloud resources, cost optimization, and continuous improvement of service stability and scalability.