Data Security

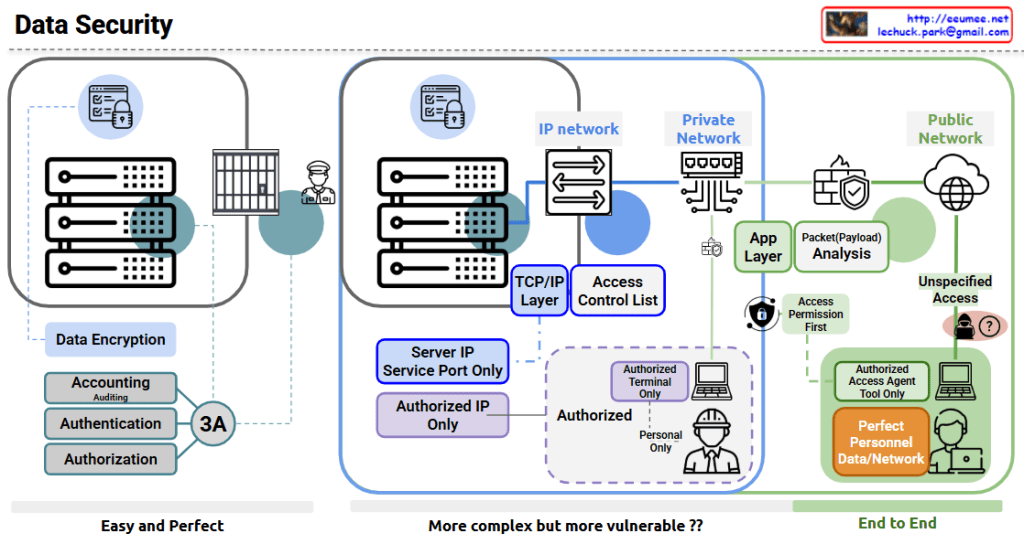
The image shows a comprehensive data security diagram with three main approaches to securing data systems. Let me explain each section:

  1. Left Section – “Easy and Perfect”:
    • Features data encryption for secure storage
    • Implements the “3A” security principles: Accounting (with Auditing), Authentication, and Authorization
    • Shows server hardware protected by physical security (guard)
    • Represents a straightforward but effective security approach
  2. Middle Section – “More complex but more vulnerable??”:
    • Shows an IP network architecture with:
      • Server IP and service port restrictions
      • TCP/IP layer security
      • Access Control Lists
      • Authorized IP only policy
      • Authorized terminal restrictions
      • Personnel authorization controls
  3. Right Section – “End to End”:
    • Divides security between Private Network and Public Network
    • Includes:
      • Application layer security
      • Packet/Payload analysis
      • Access Permission First principle
      • Authorized Access Agent Tool restrictions
      • “Perfect Personnel Data/Network” security approach
      • Unspecified Access concerns (shown with question mark)

The diagram illustrates the evolution of data security approaches from simpler encryption and authentication methods to more complex network security architectures, and finally to comprehensive end-to-end security solutions. The diagram questions whether more complex systems might actually introduce more vulnerabilities, suggesting that complexity doesn’t always equal better security.

With Claude

Key Factors in DC

This image is a diagram showing the key components of a Data Center (DC).

The diagram visually represents the core elements that make up a data center:

  1. Building – Shown on the left with a building icon, representing the physical structure of the data center.
  2. Core infrastructure elements (in the central blue area):
    • Network – Data communication infrastructure
    • Computing – Servers and processing equipment
    • Power – Energy supply systems
    • Cooling – Temperature regulation systems
  3. The central orange circle represents server racks, which is connected to power supply units (transformers), cooling equipment, and network devices.
  4. Digital Service – Displayed on the right, representing the end services that all this infrastructure ultimately delivers.

This diagram illustrates how a data center flows from a physical building through core elements like network, computing, power, and cooling to ultimately provide digital services.

With Claude

DGX Inside

NVIDIA DGX is a specialized server system optimized for GPU-centric high-performance computing. This diagram illustrates the internal architecture of DGX, which maintains a server-like structure but is specifically designed for massive parallel processing.

The core of the DGX system consists of multiple high-performance GPUs interconnected not through conventional PCIe, but via NVIDIA’s proprietary NVLink and NVSwitch technologies. This configuration dramatically increases GPU-to-GPU communication bandwidth, maximizing parallel processing efficiency.

Key features:

  • Integration of multiple CPUs and eight GPUs through high-performance interconnects
  • Mesh network configuration between all GPUs via NVSwitch, minimizing bottlenecks
  • Hierarchical memory architecture combining High Bandwidth Memory (HBM) and DRAM
  • NVMe SSDs for high-speed storage
  • High-efficiency cooling system supporting dense computing environments
  • InfiniBand networking for high-speed connections between multiple DGX systems

This configuration is optimized for workloads requiring parallel processing such as deep learning, AI model training, and large-scale data analysis, enabling much more efficient GPU utilization compared to conventional servers.

With Claude

Modular vs Rack Cluster DC

This image illustrates a comparison between two main data center architecture approaches: “Rack Cluster DC” and “Modular DC.”

On the left side, there are basic infrastructure elements depicted, representing power supply components (transformers, generators), cooling systems, and network equipment. On the right side, two different data center configuration methods are presented.

Rack Cluster Data Center (Left)

  • Features: “Dense Computing, High Power and Cooling, Scaling Unit”
  • Organized at the rack level within a cluster
  • Shows structure connected by red solid and dotted lines
  • Multiple server racks arranged in a regular pattern

Modular Data Center (Right)

  • Features: “Modular Design, Flexible Scaling, Rapid Deployment”
  • Organized at the module level, including power, cooling, and racks as integrated units
  • Shows structure connected by blue solid and dotted lines
  • Functional elements (power, cooling, servers) integrated into single modules

Both approaches display expansion units labeled “NEW” at the bottom, demonstrating the scalability of each approach.

This diagram visually compares the structural differences, scalability, and component arrangements between the traditional rack cluster approach and the modular approach to data center design.

With Claude

NVLink, Infiniband

This diagram compares two GPU networking technologies: NVLink and InfiniBand, both essential for parallel computing expansion.

On the left side, the “NVLink” section shows multiple GPUs connected vertically through purple interconnect bars. This represents the “Scale UP” approach, where GPUs are vertically scaled within a single system for tight integration.

On the right side, the “InfiniBand” section demonstrates how multiple server nodes connect through an InfiniBand network. This illustrates the “Scale Out” approach, where computing power expands horizontally across multiple independent systems.

Both technologies share the common goal of expanding parallel processing capabilities, but they do so in different architectural approaches. NVLink focuses on high-speed, direct connections between GPUs in a single system, while InfiniBand specializes in networking across multiple systems to support distributed computing environments.

The optimization of these expansion configurations is crucial for maximizing performance in high-performance computing, AI training, and other compute-intensive applications. System architects must carefully consider workload characteristics, data movement patterns, and scaling requirements when choosing between these technologies or determining how to best implement them together in hybrid configurations.

With Claude