The Computing for the Fair Human Life.

This diagram illustrates the technological shift in server-side power management from traditional AC distribution (KW-level) to advanced DC distribution (MW-level), specifically designed to address the high-power requirements and efficiency demands of AI data centers. The DC approach eliminates multiple AC-DC conversion stages, resulting in improved efficiency and better power management capabilities.
With Claude

This image is a diagram titled “Platform” that explains three types of platform business models.
3 Platforms:
Bottom Integrated Concept:
Key Message: This diagram demonstrates that platforms are not neutral technologies but embody different power relationships and value distribution structures. The second type particularly critiques the structural problems of platform labor, revealing that despite the surface narrative of “creating value together,” unequal power relationships actually exist. This is a critical visualization that analyzes the various interests and power structures hidden behind the platform economy.
With Claude

This image illustrates a comparison between two approaches for Prediction with Data.
The traditional method consists of:
This approach relies on pre-established rules and physical laws to make predictions.
The modern method follows these steps:
The most significant difference is highlighted by the question “Believe first ??” at the bottom. This represents a fundamental philosophical difference: the traditional approach starts by “believing” in predefined rules, while the AI approach learns patterns from data to make predictions.
Additionally, the AI approach features “Longtime Learning Verification,” indicating continuous model improvement through ongoing learning and validation processes.
The diagram effectively contrasts rule-based prediction systems with data-driven machine learning approaches, showing the evolution from deterministic, physics-based models to adaptive, learning-based AI systems.
With Claude

This diagram illustrates a server room thermal management system workflow.
Server Internal Components:
Temperature Monitoring Points:
Cooling System:
The bottom flowchart shows how each workload affects temperature changes (ΔT):
This system appears to be a data center thermal management solution designed to effectively handle high heat loads from AI and GPU-intensive workloads. The comprehensive temperature monitoring allows for precise control and optimization of the cooling infrastructure based on real-time workload demands.
With Claude
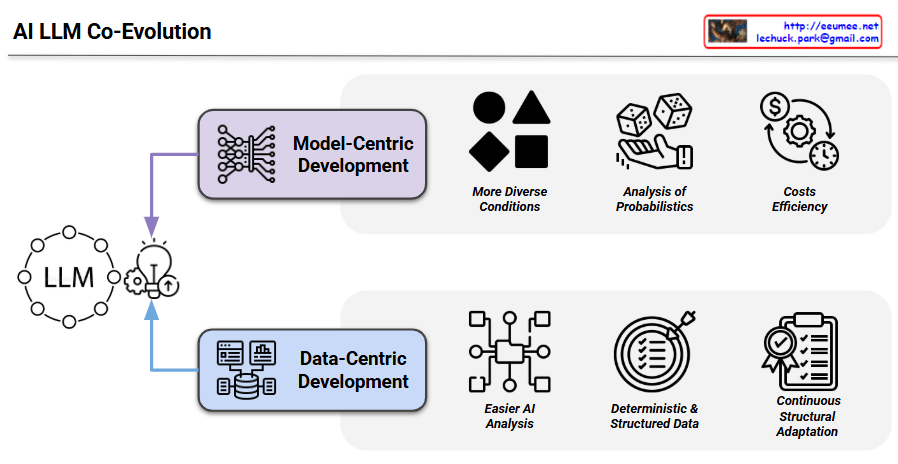
This image illustrates the AI LLM Co-Evolution process, showing how Large Language Models develop through two complementary approaches.
The diagram centers around LLM with two main development pathways:
The diagram demonstrates that modern AI development requires both model-focused and data-focused approaches to work synergistically. Each pathway offers distinct advantages:
This co-evolutionary framework suggests that the most effective LLM development occurs when both approaches are integrated, allowing for comprehensive advancement in AI system capabilities through their complementary strengths.
With Claude