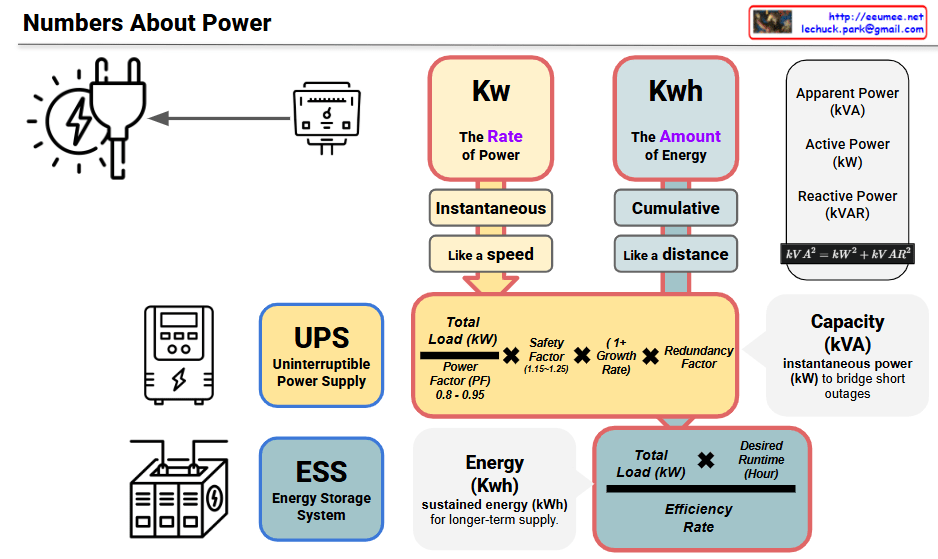
MLC, ELC from ASHRAE 90.4

This image illustrates the concepts of PUE (Power Usage Effectiveness), MLC (Mechanical Load Component), and ELC (Electrical Loss Component) as defined in ASHRAE 90.4 standard.

Key Component Analysis:

1. PUE (Power Usage Effectiveness)

  • A metric measuring data center power usage efficiency
  • Formula: PUE = (P_IT + P_mech + P_elec_loss) / P_IT
  • Total power consumption divided by IT equipment power

2. MLC (Mechanical Load Component)

  • Ratio of mechanical load component to IT power
  • Formula: MLC = P_mech / P_IT
  • Represents how much power the cooling systems (chiller, pump, cooling tower, CRAC, etc.) consume relative to IT power

3. ELC (Electrical Loss Component)

  • Ratio of electrical loss component to IT power
  • Formula: ELC = P_elec_loss / P_IT
  • Represents how much power is lost in electrical infrastructure (PDU, UPS, transformer, switchgear, etc.) relative to IT power

Diagram Structure:

Each component is connected as follows:

  • Left: Component definition
  • Center: Equipment icons (cooling systems, power systems, etc.)
  • Right: IT equipment (server racks)

Necessity and Management Benefits:

These metrics are essential for optimizing power costs that constitute a significant portion of data center operating expenses, enabling identification of inefficient cooling and power system segments to reduce power costs and determine investment priorities.

This represents the ASHRAE standard methodology for systematically analyzing data center power efficiency and creating economic and environmental value through continuous improvement.

With Claude

Human data

This updated image titled “Data?” presents a deeper philosophical perspective on data and AI.

Core Concept:

Human Perception is Limited

  • Compared to the infinite complexity of the real world, the scope that humans can perceive and define is constrained
  • The gray area labeled “Human perception is limited” visualizes this boundary of recognition

Two Dimensions of AI Application:

  1. Deterministic Data
    • Data domains that humans have already defined and structured
    • Contains clear rules and patterns that AI can process in predictable ways
    • Represents traditional AI problem-solving approaches
  2. Non-deterministic Data
    • Data from domains that humans haven’t fully defined
    • Raw data from the real world with high uncertainty and complexity
    • Areas where AI must discover and utilize patterns without prior human definitions

Key Insight: This diagram illustrates that AI’s true potential extends beyond simply solving pre-defined human problems. While AI can serve as a tool that opens new possibilities by transcending human cognitive boundaries and discovering complex patterns from the real world that we haven’t yet defined or understood, there remains a crucial human element in this process. Even as AI ventures into unexplored territories of reality beyond human-defined problem spaces, humans still play an essential role in determining how to interpret, validate, and responsibly apply these AI-discovered insights. The diagram suggests a collaborative relationship where AI expands our perceptual capabilities, but human judgment and decision-making remain fundamental in guiding how these expanded possibilities are understood and utilized.

With Claude

Road to AI

This image shows a flowchart titled “Road to AI” that illustrates the step-by-step process of AI development.

Main Stages:

  1. Digitization – Starting from a globe icon, data is converted into digital format (binary code)
  2. Central Processing Area – Data is processed through network structures, where two key processes occur in parallel:
    • Verification – Confirming data accuracy
    • Tuning – Improving the model through “Higher Resolution” and “More Relative Data”
  3. AI System – Finally implemented as an AI robot

Development Phases (Right Side):

  • “Easy First, Everybody Know” – Starting with simple tasks that everyone can understand
  • “Again & Again” – Iterative improvement process
  • “More Difficult & Auto Decision” – Advanced stage with complex and automated decision-making

This diagram visually represents how AI development progresses from simple data digitization, through continuous verification and tuning processes, and gradually evolves into sophisticated AI systems capable of complex automated decision-making. The process emphasizes the iterative nature of AI development, moving from basic, universally understood concepts to increasingly complex autonomous systems.

With Claude

Sovereign AI Foundation Model

This diagram illustrates the concept of “Sovereign AI Foundation Model” and explains why it’s necessary.

Structure Analysis

Left Side (Infrastructure Elements):

  • Data
  • Hardware Infrastructure (Hardware Infra)
  • Energy Infrastructure (Energy Infra)

These three elements are connected to the central Foundation AI Model.

Why Sovereign AI is Needed (Four boxes on the right)

  1. Sovereignty & Security
    • Securing national AI technology independence
    • Data security and technological autonomy
    • Digital Sovereignty, National Security, Avoid Tech-Colonization, Data Jurisdiction, On-Premise Control.
  2. Industrial Competitiveness
    • Strengthening AI-based competitiveness of national industries
    • Gaining advantages in technological hegemony competition
    • Ecosystem Enabler, Beyond ‘Black Box’, Deep Customization, Innovation Platform, Future Industries.
  3. Cultural & Linguistic Integrity
    • Developing AI models specialized for national language and culture
    • Preserving cultural values and linguistic characteristics
    • Cultural Context, Linguistic Nuance, Mitigate Bias, Preserve Identity, Social Cohesion.
  4. National Data Infrastructure
    • Systematic data management at the national level
    • Securing data sovereignty
    • Data Standardization, Break Data Silos, High-Quality Structured Data, AI-Ready Infrastructure, Efficiency & Scalability.

Key Message

This diagram systematically presents why each nation should build independent AI foundation models based on their own data, hardware, and energy infrastructure, rather than relying on foreign companies’ AI models. It emphasizes the necessity from the perspectives of technological sovereignty, competitiveness, cultural identity, and data independence.

The diagram essentially argues that nations need to develop their own AI capabilities to maintain control over their digital future and protect their national interests in an increasingly AI-driven world.

WIth Claude

AI Model Optimization

This image shows a diagram illustrating three major AI model optimization techniques.

1. Quantization

  • The process of converting 32-bit floating-point numbers to 8-bit integers
  • A technique that dramatically reduces model size while maintaining performance
  • Significantly decreases memory usage and computational complexity

2. Pruning

  • The process of removing less important connections or neurons from neural networks
  • Transforms complex network structures into simpler, more efficient forms
  • Reduces model size and computation while preserving core functionality

3. Distillation

  • A technique that transfers knowledge from a large model (teacher model) to a smaller model (student model)
  • Reproduces the performance of complex models in lighter, more efficient models
  • Greatly improves efficiency during deployment and execution

All three techniques are essential methods for optimizing AI models to be more efficiently used in real-world environments. They are particularly crucial technologies when deploying AI models in mobile devices or edge computing environments.

With Claude