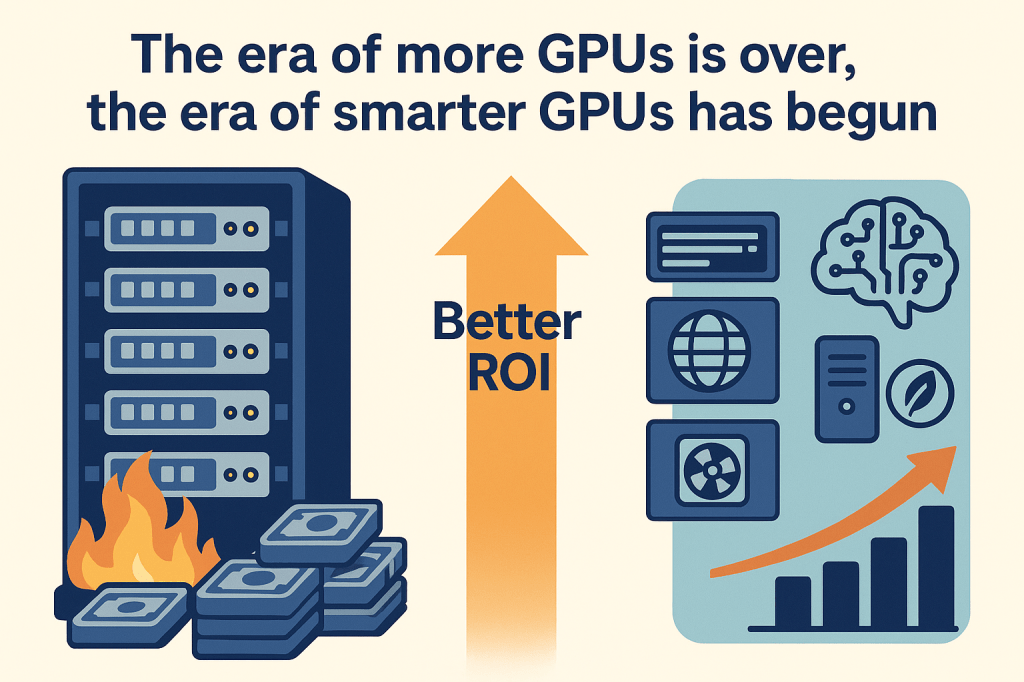
Flight LLM ( by FPGA )

Flight LLM (FPGA) Analysis

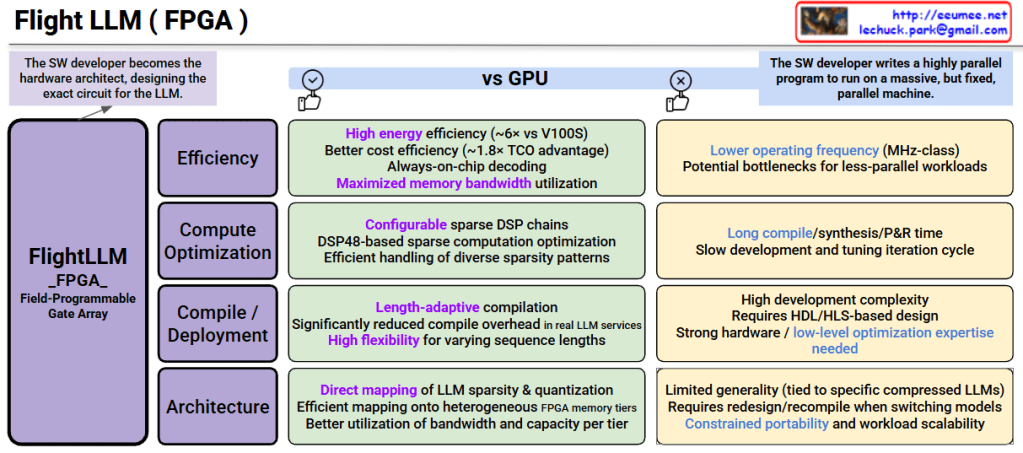
This image is a technical document comparing “FlightLLM,” an FPGA-based LLM (Large Language Model) accelerator, with GPUs.

FlightLLM_FPGA Characteristics

Core Concept: An LLM inference accelerator utilizing Field-Programmable Gate Array, where SW developers become hardware architects, designing the exact circuit for the LLM.

Advantages vs Disadvantages Compared to GPU

✓ FPGA Advantages (Green Boxes)

1. Efficiency

  • High energy efficiency (~6x vs V100S)
  • Better cost efficiency (~1.8x TCO advantage)
  • Always-on-chip decoding
  • Maximized memory bandwidth utilization

2. Compute Optimization

  • Configurable sparse DSP(Digital Signal Processor) chains
  • DSP48-based sparse computation optimization
  • Efficient handling of diverse sparsity patterns

3. Compile/Deployment

  • Length-adaptive compilation
  • Significantly reduced compile overhead in real LLM services
  • High flexibility for varying sequence lengths

4. Architecture

  • Direct mapping of LLM sparsity & quantization
  • Efficient mapping onto heterogeneous FPGA memory tiers
  • Better utilization of bandwidth and capacity per tier

✗ FPGA Disadvantages (Orange Boxes)

1. Operating Frequency

  • Lower operating frequency (MHz-class)
  • Potential bottlenecks for less-parallel workloads

2. Development Time

  • Long compile/synthesis/P&R time
  • Slow development and iteration cycle

3. Development Complexity

  • High development complexity
  • Requires HDL/HLS-based design
  • Strong hardware/low-level optimization expertise needed

4. Portability Constraints

  • Limited generality (tied to specific compressed LLMs)
  • Requires redesign/recompile when switching models
  • Constrained portability and workload scalability

Key Trade-offs Summary

FPGAs offer superior energy and cost efficiency for specific LLM workloads but require significantly higher development expertise and have lower flexibility compared to GPUs. They excel in massive, fixed parallel workloads but struggle with rapid model iteration and portability.


FlightLLM leverages FPGAs to achieve 6x energy efficiency and 1.8x cost advantage over GPUs through direct hardware mapping of LLM operations. However, this comes at the cost of high development complexity, requiring HDL/HLS expertise and long compilation times. FPGAs are ideal for production deployments of specific LLM models where efficiency outweighs the need for flexibility and rapid iteration.

#FPGA #LLM #AIAccelerator #FlightLLM #HardwareOptimization #EnergyEfficiency #MLInference #CustomHardware #AIChips #DeepLearningHardware

With Claude

UPS & ESS


UPS vs. ESS & Key Safety Technologies

This image illustrates the structural differences between UPS (Uninterruptible Power System) and ESS (Energy Storage System), emphasizing the advanced safety technologies required for ESS due to its “High Power, High Risk” nature.

1. Left Side: System Comparison (UPS vs. ESS)

This section contrasts the purpose and scale of the two systems, highlighting why ESS requires stricter safety measures.

  • UPS (Traditional System)
    • Purpose: Bridges the power gap for a short duration (10–30 mins) until the backup generator starts (Generator Wake-Up Time).
    • Scale: Relatively low capacity (25–500 kWh) and output (100 kW – N MW).
  • ESS (High-Capacity System)
    • Purpose: Stores energy for long durations (4+ hours) for active grid management, such as Peak Shaving.
    • Scale: Handles massive power (~100+ MW) and capacity (~400+ MWh).
    • Risk Factor: Labeled as “High Power, High Risk,” indicating that the sheer energy density makes it significantly more hazardous than UPS.

2. Right Side: 4 Key Safety Technologies for ESS

Since standard UPS technologies (indicated in gray text) are insufficient for ESS, the image outlines four critical technological upgrades (indicated in bold text).

① Battery Management System (BMS)

  • (From) Simple voltage monitoring and cut-off.
  • [To] Active Balancing & Precise State Estimation: Requires algorithms that actively balance cell voltages and accurately calculate SOC (State of Charge) and SOH (State of Health).

② Thermal Management System

  • (From) Simple air cooling or fans.
  • [To] Forced Air (HVAC) / Liquid Cooling: Due to high heat generation, robust air conditioning (HVAC) or direct Liquid Cooling systems are necessary.

③ Fire Detection & Suppression

  • (From) Detecting smoke after a fire starts.
  • [To] Off-gas Detection & Dedicated Suppression: Detects Off-gas (released before thermal runaway) to prevent fires early, using specialized suppressants like Clean Agents or Water Mist.

④ Physical/Structural Safety

  • (From) Standard metal enclosures.
  • [To] Explosion-proof & Venting Design: Enclosures must withstand explosions and safely vent gases.
  • [To] Fire Propagation Prevention: Includes fire barriers and BPU (Battery Protective Units) to stop fire from spreading between modules.

Summary

  • Scale: ESS handles significantly higher power and capacity (>400 MWh) compared to UPS, serving long-term grid needs rather than short-term backup.
  • Risk: Due to the “High Power, High Risk” nature of ESS, standard safety measures used in UPS are insufficient.
  • Solution: Advanced technologies—such as Liquid Cooling, Off-gas Detection, and Active Balancing BMS—are mandatory to ensure safety and prevent thermal runaway.

#ESS #UPS #BatterySafety #BMS #ThermalManagement #EnergyStorage #FireSafety #Engineering #TechTrends #OffGasDetection

WIth Gemini

ALL & ChangeD DATA-Driven

Image Analysis: Full Data AI Analysis vs. Change-Triggered Urgent Response

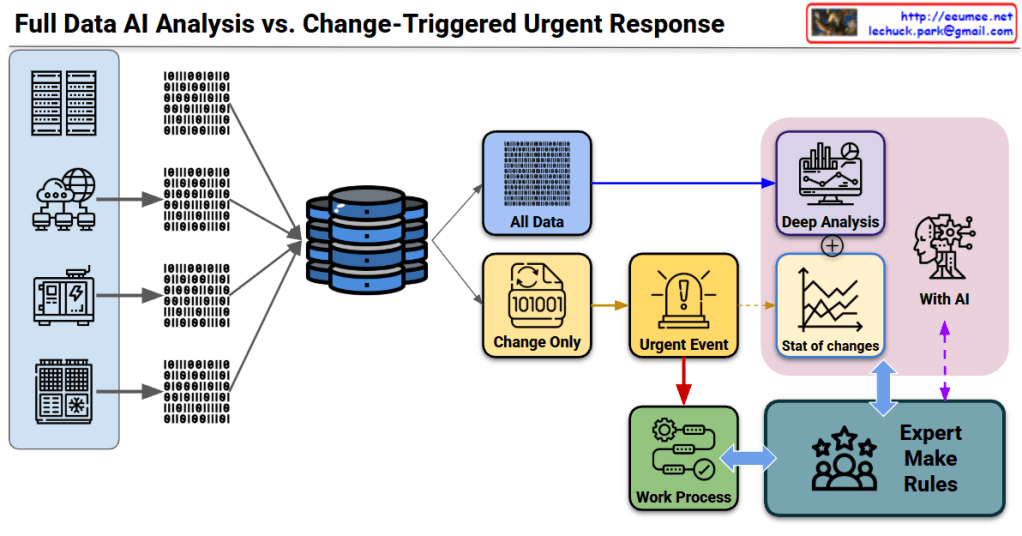
This diagram illustrates a system architecture comparing two core strategies for data processing.

🎯 Core 1: Two Data Processing Approaches

Approach A: Full Data Processing (Analysis)

  • All Data path (blue)
  • Collects and comprehensively analyzes all data
  • Performs in-depth analysis through Deep Analysis
  • AI-powered statistical change (Stat of changes) analysis
  • Characteristics: Identifies overall patterns, trends, and correlations

Approach B: Separate Change Detection Processing

  • Change Only path (yellow)
  • Selectively detects only changes
  • Extracts and processes only deltas (differences)
  • Characteristics: Fast response time, efficient resource utilization

🔥 Core 2: Analysis→Urgent Response→Expert Processing Flow

Stage 1: Analysis

  • Full Data Analysis: AI-based Deep Analysis
  • Change Detection: Change Only monitoring

Stage 2: Urgent Response (Urgent Event)

  • Immediate alert generation when changes detected (⚠️ Urgent Event)
  • Automated primary response process execution
  • Direct linkage to Work Process

Stage 3: Expert Processing (Expert Make Rules)

  • Human expert intervention
  • Integrated review of AI analysis results + urgent event information
  • Creation and modification of situation-appropriate rules
  • Work Process optimization

🔄 Integrated Process Flow

[Data Collection] 
    ↓
[Path Bifurcation]
    ├─→ [All Data] → [Deep Analysis] ─┐
    │                                  ├→ [AI Statistical Analysis]
    └─→ [Change Only] → [Urgent Event]─┘
                            ↓
                    [Work Process] ↔ [Expert Make Rules]
                            ↑_____________↓
                         (Feedback loop with AI)

💡 Core System Value

  1. Dual Processing Strategy: Stability (full analysis) + Agility (change detection)
  2. 3-Stage Response System: Automated analysis → Urgent process → Expert judgment
  3. AI + Human Collaboration: Combines AI analytical power with human expert judgment
  4. Continuous Improvement: Virtuous cycle where expert rules feed back into AI learning

This system is an architecture optimized for environments where real-time response is essential while expert judgment remains critical (manufacturing, infrastructure operations, security monitoring, etc.).


Summary

  1. Dual-path system: Comprehensive full data analysis (stability) + selective change detection (speed) working in parallel
  2. Three-tier response: AI automated analysis triggers urgent events, followed by work processes and expert rule refinement
  3. Human-AI synergy: Continuous improvement loop where expert knowledge enhances AI capabilities while AI insights inform expert decisions

#DataArchitecture #AIAnalysis #EventDrivenArchitecture #RealTimeMonitoring #HybridProcessing #ExpertSystems #ChangeDetection #UrgentResponse #IndustrialAI #SmartMonitoring #DataProcessing #AIHumanCollaboration #PredictiveMaintenance #IoTArchitecture #EnterpriseAI

Multi-Head Latent Attention – Latent KV-Cache (DeepSeek v3)

Multi-Head Latent Attention – Latent KV-Cache Interpretation

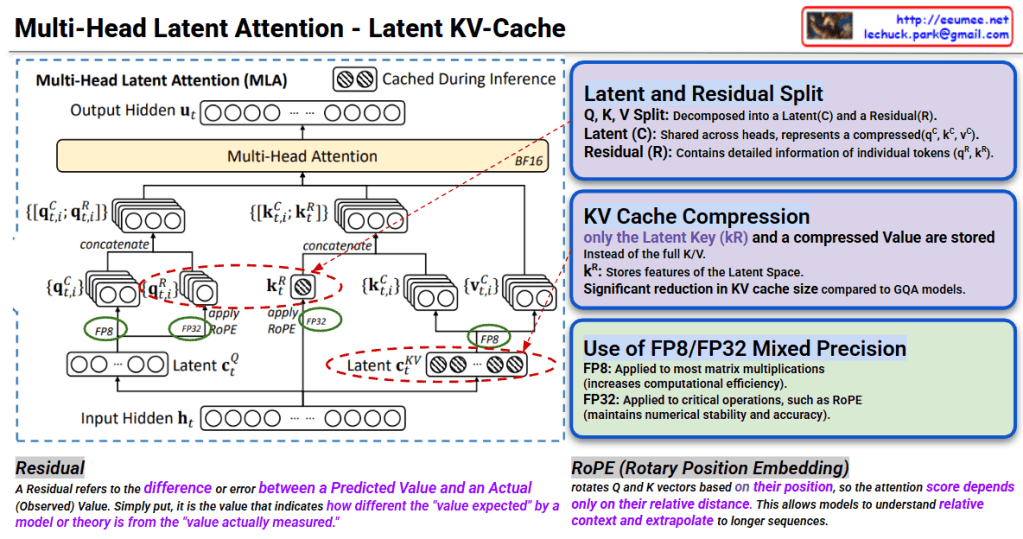
This image explains the Multi-Head Latent Attention (MLA) mechanism and Latent KV-Cache technique for efficient inference in transformer models.

Core Concepts

1. Latent and Residual Split

Q, K, V are decomposed into two components:

  • Latent (C): Compressed representation shared across heads (q^c, k^c, v^c)
  • Residual (R): Contains detailed information of individual tokens (q^R, k^R)

2. KV Cache Compression

Instead of traditional approach, stores only in compressed form:

  • k^R (Latent Key): Stores only Latent Space features
  • Achieves significant reduction in KV cache size compared to GQA models

3. Operation Flow

  1. Generate Latent c_t^Q from Input Hidden h_t (using FP8)
  2. Create q_{t,i}^C, q_{t,i}^R through Latent
  3. k^R and v^c are concatenated and fed to Multi-Head Attention
  4. Caching during inference: Only k^R and compressed Value stored (shown with checkered icon)
  5. Apply RoPE (Rotary Position Embedding) for position information

4. FP8/FP32 Mixed Precision

  • FP8: Applied to most matrix multiplications (increases computational efficiency)
  • FP32: Applied to critical operations like RoPE (maintains numerical stability)

Key Advantages

  • Memory Efficiency: Caches only compressed representations instead of full K, V
  • Computational Efficiency: Fast inference using FP8
  • Long Sequence Processing: Enables understanding of long contexts through relative position information

Residual & RoPE Explanation

  • Residual: The difference between predicted and actual values (“difference between expected and measured values”)
  • RoPE: A technique that rotates Q and K vectors based on position, allowing attention scores to be calculated using only relative distances

Summary

This technique represents a cutting-edge optimization for LLM inference that dramatically reduces memory footprint by storing only compressed latent representations in the KV cache while maintaining model quality. The combination of latent-residual decomposition and mixed precision (FP8/FP32) enables both faster computation and longer context handling. RoPE further enhances the model’s ability to understand relative positions in extended sequences.

#MultiHeadAttention #LatentAttention #KVCache #TransformerOptimization #LLMInference #ModelCompression #MixedPrecision #FP8 #RoPE #EfficientAI #DeepLearning #AttentionMechanism #ModelAcceleration #AIOptimization #NeuralNetworks

With Cluade

TDP (Thermal Design power)

TDP (Thermal Design Power) Interpretation

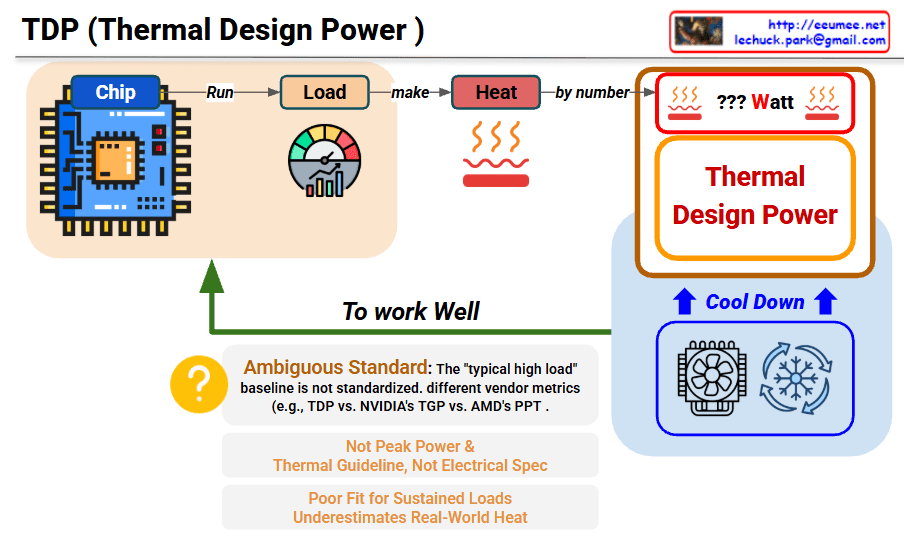
This image explains the concept and limitations of TDP (Thermal Design Power).

Main Process

Chip → Run Load → Generate Heat → TDP Measurement

  1. Chip: Processor/chip operates
  2. Load (Run): Executes specific workload
  3. Heat (make): Heat is generated (measured by number)
  4. ??? Watt: Displayed as TDP value

Role of TDP

  • Thermal Design Guideline: Reference for cooling system design
  • Cool Down: Serves as baseline for cooling solutions like fans and coolers

⚠️ Critical Limitations

Ambiguous Standard

  • “Typical high load” baseline is not standardized
  • Different measurement methods across vendors:
    • Intel’s TDP
    • NVIDIA’s TGP (Total Graphics Power)
    • AMD’s PPT (Package Power Tracking)

Problems with TDP

  1. Not Peak Power – Average value, not maximum power consumption
  2. Thermal Guideline, Not Electrical Spec – Just a guide for thermal management
  3. Poor Fit for Sustained Loads – Doesn’t properly reflect real high-load scenarios
  4. Underestimates Real-World Heat – Measured lower than actual heat generation

Summary

TDP is a thermal guideline for cooling system design, not an accurate measure of actual power consumption or heat generation. Different manufacturers use inconsistent standards (TDP/TGP/PPT), making comparisons difficult. It underestimates real-world heat and peak power, serving only as a reference point rather than a precise specification.

#TDP #ThermalDesignPower #CPUCooling #PCHardware #ThermalManagement #ComputerCooling #ProcessorSpecs #HardwareEducation #TechExplained #CoolingSystem #PowerConsumption #PCBuilding #TechSpecs #HeatDissipation #HardwareLimitations

With Claude