Network : Road to the peer

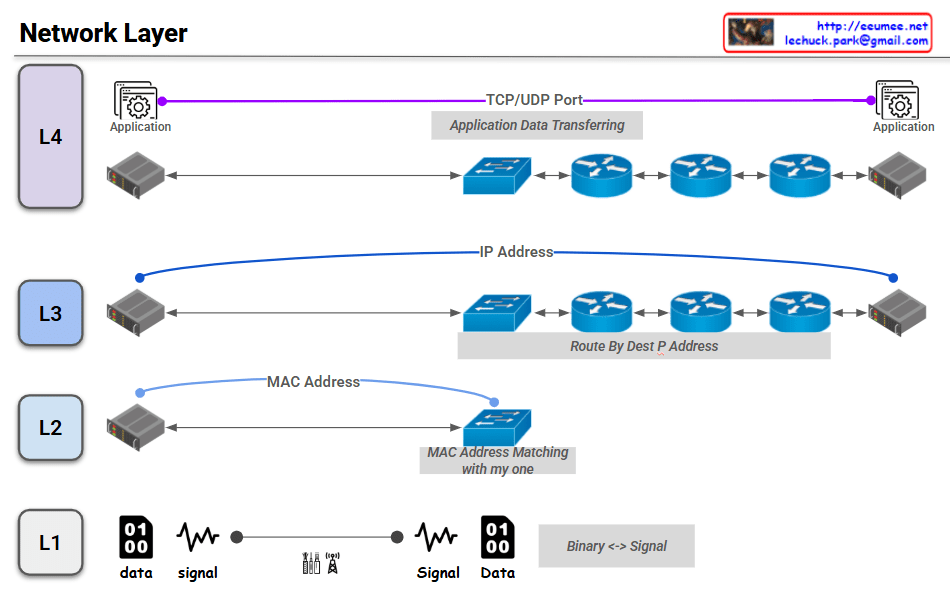
The provided image is a diagram that visually explains the roles and addressing schemes used by the lower four layers (L1 to L4) of a network model during data communication. Here is a detailed breakdown of each layer shown in the image:

  • L4 (Transport Layer):
    • A purple line illustrates the logical end-to-end connection between Applications on the source and destination servers.
    • It uses TCP/UDP Port numbers to identify the specific application receiving the data, handling “Application Data Transferring.”
  • L3 (Network Layer):
    • A blue line represents the logical connection from the source host to the destination host across the network.
    • It utilizes the IP Address, where intermediate routers perform routing to find the best path to the destination (“Route By Dest IP Address”).
  • L2 (Data Link Layer):
    • A light blue line demonstrates node-to-node communication between directly connected devices (e.g., a server and a switch).
    • It uses the MAC Address for local delivery, ensuring the destination MAC address matches the device’s own hardware address (“MAC Address Matching with my one”).
  • L1 (Physical Layer):
    • This layer depicts the conversion between digital information and physical transmission mediums.
    • It shows how binary data (“01 00 data”) is translated into electrical, light, or radio waveforms (“signal”) and vice versa (“Binary <-> Signal”) over cables or wireless antennas.

📝 Summary

This image is an excellent educational visualization that breaks down how data travels across network devices (servers, switches, routers). It intuitively maps out the specific protocols and addressing systems applied at each level: L1 (Physical Signals) -> L2 (MAC Addresses) -> L3 (IP Addresses) -> L4 (Port Numbers).This image is an excellent educational visualization that breaks down how data travels across network devices (servers, switches, routers). It intuitively maps out the specific protocols and addressing systems applied at each level: L1 (Physical Signals) -> L2 (MAC Addresses) -> L3 (IP Addresses) -> L4 (Port Numbers).

#NetworkLayer #OSIModel #NetworkingBasics #L1toL4 #DataCommunication #TCPIP #ITInfrastructure

With Gemini
TCP/IP Better

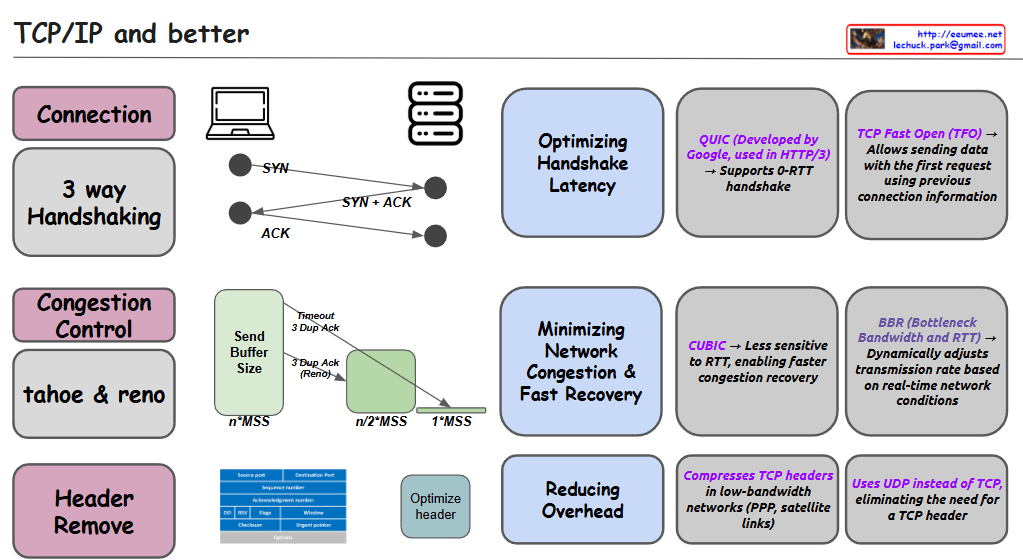
This image is an informational diagram titled “TCP/IP and better” that explains various aspects of network protocols and optimizations.

The diagram is organized into three main sections:

  1. Connection
    • Shows “3 way Handshaking” with a visual representation of the SYN, SYN+ACK, ACK sequence
    • “Optimizing Handshake Latency” section mentions:
      • QUIC (Developed by Google, used in HTTP/3) → Supports 0-RTT handshake
      • TCP Fast Open (TFO) → Allows sending data with the first request using previous connection information
  2. Congestion Control
    • Lists “tahoe & reno” congestion control algorithms
    • Shows diagrams of Send Buffer Size with concepts like “Timeout 3-Dup-Ack” and “3-Dup Ack (Reno)”
    • “Minimizing Network Congestion & Fast Recovery” section mentions:
      • CUBIC → Less sensitive to RTT, enabling faster congestion recovery
      • BBR (Bottleneck Bandwidth and RTT) → Dynamically adjusts transmission rate based on real-time network conditions
  3. Header Remove
    • Shows TCP header structure diagram and “Optimize header” section
    • “Reducing Overhead” section mentions:
      • Compresses TCP headers in low-bandwidth networks (PPP, satellite links)
      • Uses UDP instead of TCP, eliminating the need for a TCP header

The diagram appears to be an educational resource about TCP/IP protocols and various optimizations that have been developed to improve network performance, particularly focused on connection establishment, congestion control, and overhead reduction.

With Claude

All are by packets

From Claude with some prompting
Let me explain this network diagram which illustrates packet processing and various network devices:

  1. Network Components:
  • Internet: Shows L3-L7 packet flowing
  • Router: Handles L3 routing and packet control
  • Firewall/IPS/IDS: Manages L3/L4 base packet control and L7 packet analysis/control
  • Switching: Performs Ethernet(L2/L3) switching and L2/L3 packet control
  • Server/Client: Handles packet send & receive (L1-L7), packet making and analysis
  1. Key Issues:
  • COST Concerns:
    • ALL operations are packet-based
    • Performs L1-L7 packet collecting/analysis/switching/routing
    • Multiple devices perform many duplicates of the same functions (L2, L3-L4 packet collecting/analysis/switching/routing)
  1. Suggested Improvement:
  • Mentioned in “IF Possible” section:
    • Consider aggregating all packets and manipulating them from central controls
    • This could potentially reduce redundancy and improve efficiency
  1. Key Message:
  • There are many types of packet processing devices on the network
  • Redundancy occurs as each device performs similar functions
  • Need to explore possibility of centralized packet management system

The diagram effectively highlights the complexity and redundancy in modern network architecture while suggesting a potential path toward more efficient packet processing through centralization.

This visualization emphasizes how current network infrastructure might benefit from consolidation of packet processing functions to reduce duplicated efforts and potentially lower costs.

nagle for TCP

From Claude with some prompting
This image illustrates the TCP (Transmission Control Protocol) packet structure and the Nagle algorithm.

  1. Top section:
    • Shows data transfer between two computers.
    • Demonstrates how data (payload) is divided into multiple packets for transmission.
  2. Middle section – Packet structure:
    • Data Payload: The actual data being transmitted
    • TCP/IP header: Contains control information for communication
    • Ethernet header: 14 Bytes
    • IPv4 header: 20 Bytes
    • TCP header: 20 Bytes
    • Data + Padding: Actual data and padding added if necessary
    • MTU Limit: Maximum Transmission Unit limit
  3. Bottom section – Nagle’s Algorithm:
    • Normal TCP/IP transmission: Small data packets are sent individually
    • With Nagle’s Algorithm: Small data packets are combined into larger packets before transmission
    • Packet sending conditions:
      1. When an ACK is received
      2. On timeout
      3. When the TCP sending window overflows

The image effectively demonstrates the packet structure in TCP communications and explains how the Nagle algorithm improves network efficiency. The main purpose of Nagle’s algorithm is to reduce network overhead by bundling small packets together before transmission.

DNS work sequence

From Claude with some prompting
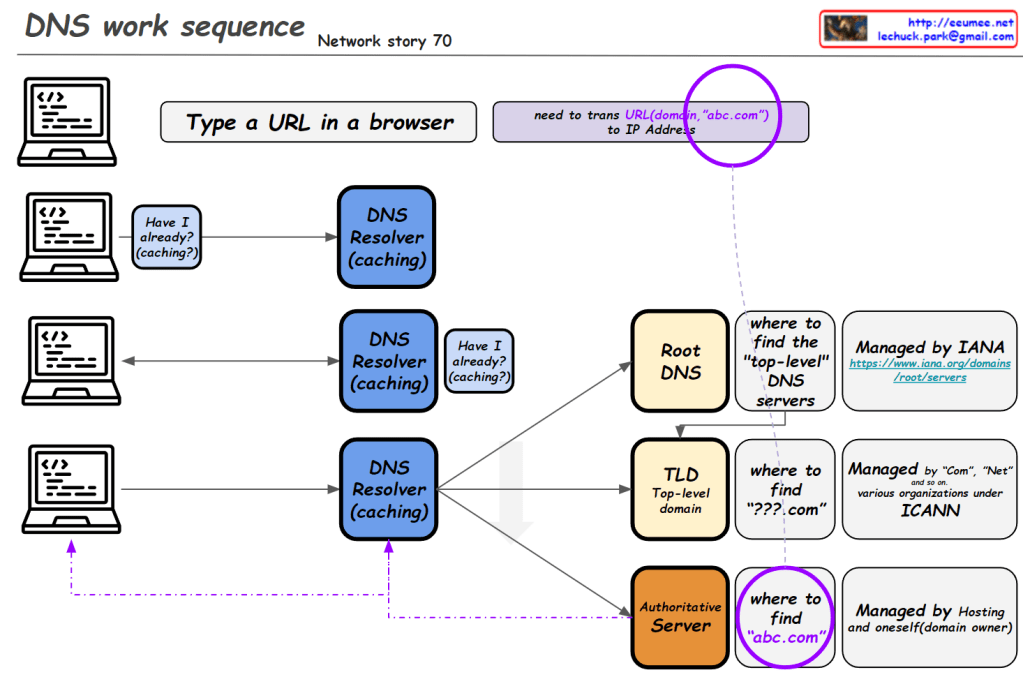
This image illustrates the DNS (Domain Name System) work sequence. Here’s a breakdown:

  1. It starts with typing a URL in a browser. For example, entering “abc.com” requires translation to an IP address.
  2. The DNS resolution process begins, involving multiple levels of DNS resolvers with caching capabilities.
  3. At each level, there’s a “Have I already? (caching?)” check. If the information is cached, it’s used immediately.
  4. If not found, it proceeds to the next level:
    • Root DNS: Provides information on top-level DNS servers (Managed by IANA)
    • TLD (Top-Level Domain): Gives information on domains like “.com” (Managed by various organizations under ICANN)
    • Authoritative Server: Provides actual domain information (e.g., abc.com, managed by hosting providers or domain owners)
  5. Through these stages, the system finds the necessary information to ultimately obtain the IP address of the entered domain.

This diagram effectively demonstrates the hierarchical structure of DNS lookup process and the caching mechanism at each stage.

DNS Why?

From Claude with some prompting
This image is a network diagram explaining the function and importance of DNS (Domain Name System). The main points are:

  1. WWW service works with DNS on TCP/IP.
  2. DNS is responsible for mapping domains to IP addresses.
  3. All network devices on the Internet can only route to IP addresses.
  4. It’s difficult to include actual service characteristics in IP addresses (only by number).
  5. Domain addresses are easy to use and must be mapped to IP addresses.
  6. On the client side, there’s a DNS Resolver (caching).
  7. On the server side, there’s a DNS server, which includes Authoritative Server, Root Server, and TLD Server. These are managed by IANA.
  8. At the center of the diagram is the key question: “So, how does DNS-IP Mapping work?”

This diagram visually explains the working principle of DNS and its importance in the Internet. It emphasizes the crucial role DNS plays in translating user-friendly domain names into IP addresses that computers can understand.

Tahoe & Reno

From Claude with some prompting
This image is a diagram explaining the TCP Congestion Control mechanisms, particularly comparing the congestion control algorithms of two TCP versions: Tahoe and Reno.

Key points:

  1. Both algorithms use a Slow Start Threshold (ssthresh) to determine the initial congestion window size.
  2. The congestion window grows exponentially (2^n) at first, then switches to linear growth (+1) once it reaches ssthresh.
  3. Both algorithms reduce the congestion window to 1 and adjust ssthresh to half of the current size upon a timeout.
  4. When receiving 3 duplicate ACKs (3 DUP ACK), both algorithms halve their ssthresh.

Difference:

  • On 3 DUP ACK:
    • Tahoe: Reduces congestion window to 1
    • Reno: Multiplicatively decreases congestion window

There doesn’t appear to be any incorrect information in this image. It accurately shows the key difference between Tahoe and Reno in their response to 3 DUP ACK situations, and correctly explains other aspects of congestion control as well.