DC Data Collecting Performance Factors

From Claude with some prompting
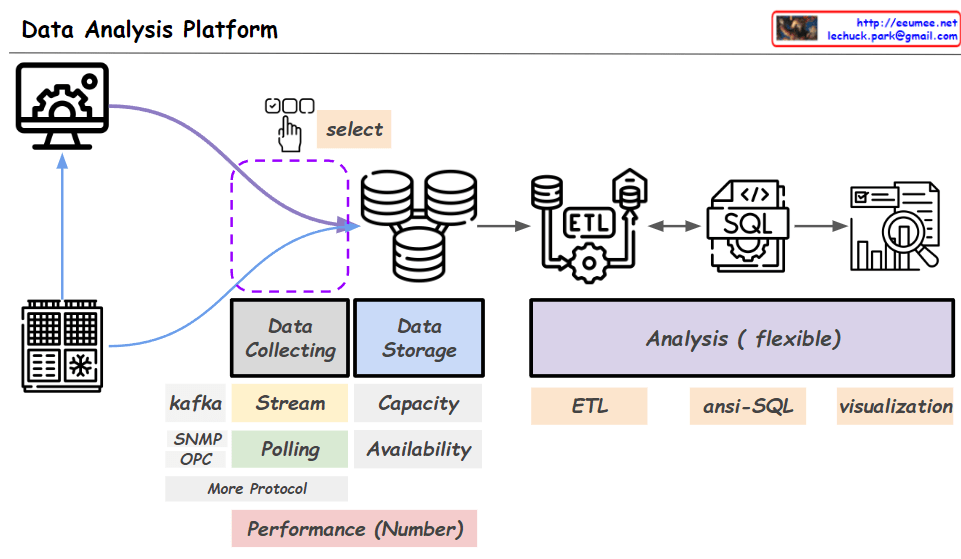
This image conceptually illustrates various factors that can affect the performance of DC data collection. The main components include the facility generating the data, the facility network, PLC/DDC converters, an integration network, and the final collection/analysis system.

Factors that can impact data collection performance include the data generation rate, CPU performance, bandwidth limitations of the network medium, network topology, protocols used (such as TCP/IP and SNMP), input/output processing performance, and program logic.

The diagram systematically outlines the overall flow of the DC data collection process and the performance considerations at each stage. It covers elements like the facility, network infrastructure, data conversion, integration, and final collection/analysis.

By mapping out these components and potential bottlenecks, the image can aid in the design and optimization of data collection systems. It provides a comprehensive overview of the elements that need to be accounted for to ensure efficient data gathering performance.


MaKING “1”

From Claude with some prompting
This image emphasizes the crucial importance of obtaining high-quality data from the real world for the advancement of the digital world, particularly artificial intelligence (AI).

The real-world section depicts the complex series of steps required to produce a “perfect 1,” or a product of excellent quality (e.g., an apple), including growing trees, harvesting, transportation, and selling.

In contrast, the digital world represents this intricate process through a simple mathematical computation (1 + 1 = 2). However, the image conveys that securing flawless data from the real world is an extremely important and arduous process for AI to develop and improve.

In essence, the image highlights that the complex process of extracting high-quality data from the physical realm is essential for enhancing AI performance. It serves as a reminder that this crucial aspect should not be overlooked or underestimated.

The overall message is that for AI to advance in the digital world, obtaining pristine data from the real world through an intricate series of steps is an indispensable and challenging requirement that must be prioritized.

Data Quality

From Claude with some prompting
This image is an infographic explaining the concept of data quality. It shows the flow of data from a facility or source, going through various stages of power consumption like generating, medium, converting, network, and computing power. The goal is to ensure reliable data with good performance and high resolution for optimal analysis and better insights represented by icons and graphs.

The key aspects highlighted are:

  1. Data origin at a facility
  2. Different power requirements at each data stage (generating, medium, converting, network, computing)
  3. Desired qualities of reliable data, good performance, high resolution
  4. End goal of collecting/analyzing data for better insights

The infographic uses a combination of text labels, icons, and diagrams to illustrate the data quality journey from source to valuable analytical output in a visually appealing manner.

New infra age

From Claude with some prompting
This image illustrates the surge in data and the advancement of AI technologies, particularly parallel processing techniques that efficiently handle massive amounts of data. As a result, there is a growing need for infrastructure technologies that can support such data processing capabilities. Technologies like big data processing, parallel processing, direct memory access, and GPU computing have evolved to meet this demand. The overall flow depicts the data explosion, the advancement of AI and parallel processing techniques, and the evolution of supporting infrastructure technologies.

DPU

From Claude with some prompting
The image illustrates the role of a Data Processing Unit (DPU) in facilitating seamless and delay-free data exchange between different hardware components such as the GPU, NVME (likely referring to an NVMe solid-state drive), and other devices.

The key highlight is that the DPU enables “Data Exchange Parallely without a Delay” and provides “Seamless” connectivity between these components. This means the DPU acts as a high-speed interconnect, allowing parallel data transfers to occur without any bottlenecks or latency.

The image emphasizes the DPU’s ability to provide a low-latency, high-bandwidth data processing channel, enabling efficient data movement and processing across various hardware components within a system. This seamless connectivity and delay-free data exchange are crucial for applications that require intensive data processing, such as data analytics, machine learning, or high-performance computing, where minimizing latency and maximizing throughput are critical.

==================

The key features of the DPU highlighted in the image are:

  1. Data Exchange Parallely: The DPU allows parallel data exchange without delay or bottlenecks, enabling seamless data transfer.
  2. Interconnection: The DPU interconnects different components like the GPU, NVME, and other devices, facilitating efficient data flow between them.

The DPU aims to provide a high-speed, low-latency data processing channel, enabling efficient data movement and computation between various hardware components in a system. This can be particularly useful in applications that require intensive data processing, such as data analytics, machine learning, or high-performance computing.Cop

Data Analysis Platform

From Claude with some prompting
The given image illustrates the overall architecture of a data analysis platform. At the data collecting stage, data is gathered from actual equipment or systems (servers). Protocols like Kafka, SNMP, and OPC are used for data streaming or polling.

The ‘select’ part indicates selecting specific data from the entire collected dataset. Based on the configuration information of the actual equipment, only the data of interest can be selectively collected, allowing the expansion of the data collection scope.

The selected data is stored in a data storage system and then loaded into an SQL database through an ETL (Extract, Transform, Load) process. Afterward, flexible data analysis is enabled using tools like ETL, ansi-SQL, and visualization.

Performance metrics for the entire process are provided numerically, and analysis tasks can be performed through the user interface of the data analysis platform.

The key aspects highlighted are the collection of data from actual equipment/systems, selective data collection based on equipment configuration, data storage, ETL process, SQL database, analysis tools (ETL, SQL, visualization), performance metrics, and the analysis platform user interface.

RAG

From Claude with some prompting
This image explains the concept and structure of the RAG (Retrieval-Augmented Generation) model.

First, a large amount of data is collected from the “Internet” and “Big Data” to train a Foundation Model. This model utilizes Deep Learning and Attention mechanisms.

Next, the Foundation Model is fine-tuned using reliable and confirmed data from a Specific Domain (Specific Domain Data). This process creates a model specialized for that particular domain.

Ultimately, this allows the model to provide more reliable responses to users in that specific area. The overall process is summarized by the concept of Retrieval-Augmented Generation.

The image visually represents the components of the RAG model and the flow of data through the system effectively.