Network 1

From Claude with some prompting
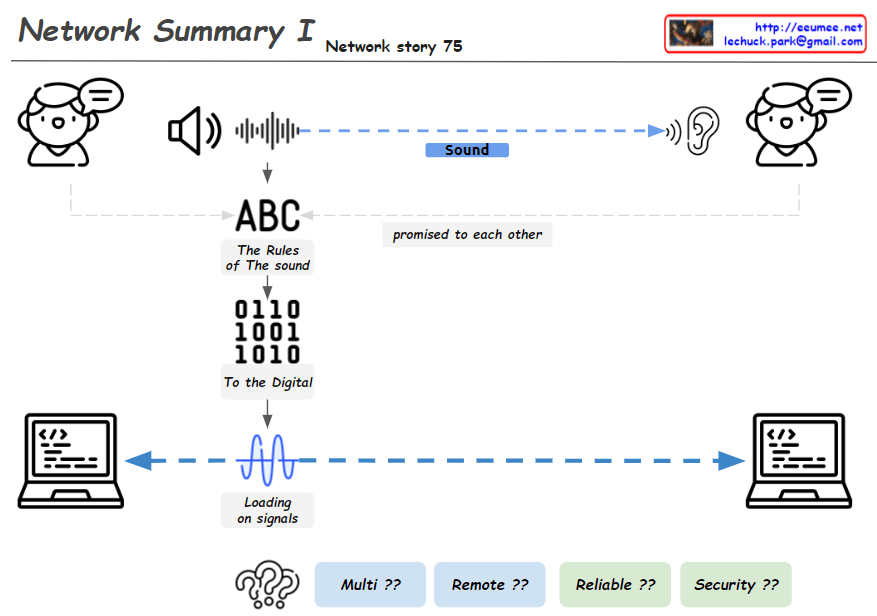
This image, titled “Network Summary I”, illustrates the basic process of network communication in several steps:

  1. Sound Transmission: It shows sound being transmitted between two people.
  2. Communication Rules: The phrase “ABC – The Rules of The sound” indicates that there are agreed-upon rules for sound transmission.
  3. Digital Conversion: It demonstrates how sound is converted into digital signals, represented as “0110 1001 1010”.
  4. Signal Transmission: The phrase “Loading on signals” along with a waveform shows how signals are transmitted between two computers.
  5. Network Challenges: At the bottom, the questions “Multi ??”, “Remote ??”, “Reliable ??”, and “Security ??” present key issues to be addressed after establishing a network connection.

This diagram provides a basic overview of how voice communication is converted to digital data and transmitted over computer networks. It then poses questions about how to handle multiplexity, remote connections, reliability, and security in actual network implementations.

By presenting these challenges, the image implies the necessity for more complex networking protocols like TCP/IP and various networking equipment. It effectively summarizes the journey from basic principles of network communication to the complex issues faced in real-world network implementation, serving as an educational tool to introduce networking concepts.

Before & Optimization

From Claude with some prompting
This image illustrates the process of “Before & Optimization” in a system, divided into three main stages:

  1. Initial State:
    • Shows “Supply” and “Usage” components.
    • Demonstrates a stable supply flowing to usage.
    • The graph indicates supply maintaining slightly above usage.
  2. Intermediate Stage:
    • Introduces “Redundancy (High Availability)”.
    • An additional supply unit labeled “One More Ready” is added.
    • The “Stability” graph shows supply consistently higher than usage, with the note “Maintain Supply > Usage”.
  3. Final Optimization Stage:
    • The “Optimization” graph shows supply and usage being closely aligned.
    • Purple arrows indicate adjustments to match supply with usage.
    • Labeled “Goto Supply = Usage”, showing the goal of matching supply to usage.

Overall, this image depicts the progression from ensuring stable supply, through adding redundancy for increased stability, to finally optimizing the system by matching supply closely with usage. It demonstrates the process of maintaining system stability while improving efficiency.

Server Room Stability & Optimization

From Claude with some prompting
Server Room Stability & Optimization

  1. Cooling Supply: Ensuring sufficient cooling capacity to effectively dissipate the heat generated by the servers
  2. Power Usage: Monitoring and managing the power consumption of the servers
  3. Power Supply: Maintaining a stable and reliable power supply to the server room
  4. Resource Check:
    • Power Resource: Verifying the ability to provide the necessary power supply for the server usage
    • Cooling Resource: Checking the cooling capacity to effectively handle the heat generated by the servers
  5. Anomaly Detection: Identifying any anomalies or unusual patterns in the server room’s behavior
  6. Stability: Maintaining the power and cooling resource supply to meet or exceed the server usage requirements
  7. Optimizing: Based on the stability analysis, optimizing the power and cooling resource supply to match the server usage

The key focus is on the appropriate management and provisioning of both power and cooling resources to ensure the overall stability and optimization of the server room operations.

CPU + GPU

From Claude with some prompting
This image outlines the latest trends and developments in CPU and GPU technologies. The key points are:

  1. CPU: It shows advancements in multi-core and multi-threading (multi-processing) capabilities, as well as architectural improvements (cache, prediction work).
  2. GPU: It highlights the improvements in real-time parallel processing and data-centric processing capabilities.
  3. AI Accelerator: Hardware technologies that accelerate AI algorithms are evolving.
  4. Power Efficiency: Improving power efficiency is emerging as an important challenge.
  5. Convergence: The image suggests a trend of convergence and integration between CPUs and GPUs.

Overall, the image presents the evolving directions where CPU and GPU technologies are complementing each other and converging. This is expected to drive improvements in performance and power efficiency.

Automation System

From Claude with some prompting
This image illustrates an Automation process, consisting of two main parts:

  1. Upper section:
    • Shows a basic automation process consisting of Condition and Action.
    • Real Data (Input) and Real Plan (Output) are fed into a Software System.
  2. Lower section:
    • Depicts a more complex automation process.
    • Alternates between manual operations (hand holding hammer icon) and software systems (screen with gear icon).
    • This represents the integration of manual tasks and automated systems.
    • Key features of the process:
      • Use of Accurate Verified Data
      • 24/7 Stable System operation
      • Continuous Optimization
    • Results: More Efficient process with Cost & Resource reduction

The hammer icon represents manual interventions, working in tandem with automated software systems to enhance overall process efficiency. This approach aims to achieve optimal results by combining human involvement with automation systems.

The image demonstrates how automation integrates real-world tasks with software systems to increase efficiency and reduce costs and resources.

Connections of minorities

From Claude with some prompting
The image titled “Connections of minorities” compares “Before” and “Now” scenarios:

“Before”:

  • Large blue circles (representing the majority) are connected and growing.
  • Small black circles (representing minorities) are isolated.
  • Caption: “Only the majority connects and grows.”

“Now”:

  • Large blue circles remain connected, but small black circles start connecting.
  • New large black circles appear, connecting the minorities.
  • Caption: “Minorities also can make connections.”

A central element labeled “Data Collector (Internet)” and “AI Data Processor” suggests these changes are due to internet and AI technology advancements.

The bottom asks: “The Minor is Good or Bad???, The Major also”. This prompts consideration of whether increased connections for minorities and majorities are positive or negative.

Overall, the image illustrates how technological progress has provided minorities with more opportunities for connection, and invites reflection on the implications of these changes.CopyRet