What is The Next?

With Claude
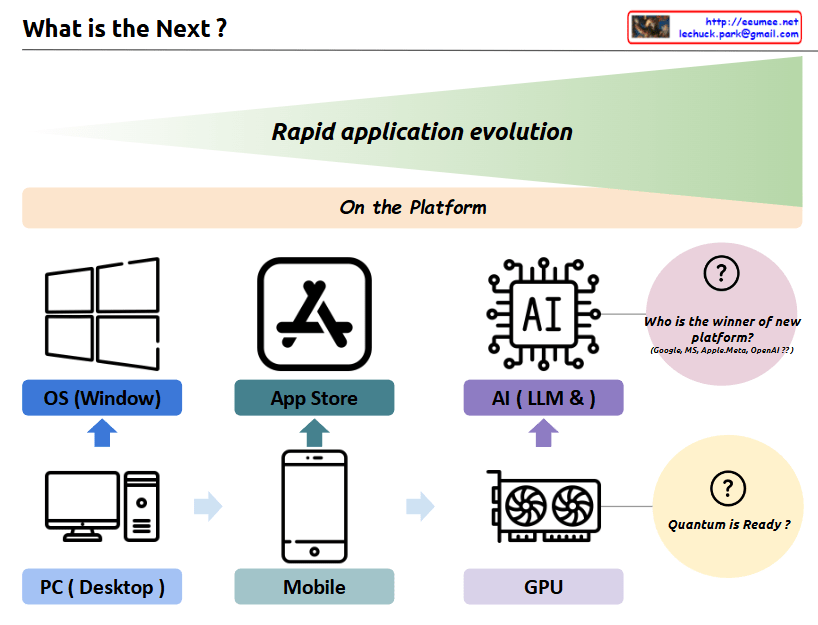
a comprehensive interpretation of the image and its concept of “Rapid application evolution”:

The diagram illustrates the parallel evolution of both hardware infrastructure and software platforms, which has driven rapid application development and user experiences:

  1. Hardware Infrastructure Evolution:
  • PC/Desktop → Mobile Devices → GPU
  • Represents the progression of core computing power platforms
  • Each transition brought fundamental changes in how users interact with technology
  1. Software Platform Evolution:
  • Windows OS → App Store → AI/LLM
  • Shows the evolution of application ecosystems
  • Each platform created new possibilities for user applications

The symbiotic relationship between these two axes:

  • PC Era: Integration of PC hardware with Windows OS
  • Mobile Era: Combination of mobile devices with app store ecosystems
  • AI Era: Marriage of GPU infrastructure with LLM/AI platforms

Each transition has led to exponential growth in application capabilities and user experiences, with hardware and software platforms developing in parallel and reinforcing each other.

Future Outlook:

  1. “Who is the winner of new platform?”
  • Current competition between Google, MS, Apple/Meta, OpenAI
  • Platform leadership in the AI era remains undecided
  • Possibility for new players to emerge
  1. “Quantum is Ready?”
  • Suggests quantum computing as the next potential hardware revolution
  • Implies the possibility of new software platforms emerging to leverage quantum capabilities
  • Continues the pattern of hardware-software co-evolution

This cyclical pattern of hardware-software evolution suggests that we’ll continue to see new infrastructure innovations driving platform development, and vice versa. Each cycle has dramatically expanded the possibilities for applications and user experiences, and this trend is likely to continue with future technological breakthroughs.

The key insight is that major technological leaps happen when both hardware infrastructure and software platforms evolve together, creating new opportunities for application development and user experiences that weren’t previously possible.

Metric Analysis

With a Claude
This image depicts the evolution of data analysis techniques, from simple time series analysis to increasingly sophisticated statistical methods, machine learning, and deep learning.

As the analysis approaches become more advanced, the process becomes less transparent and the results more difficult to explain. Simple techniques are more easily understood and allow for deterministic decision-making. But as the analysis moves towards statistics, machine learning, and AI, the computations become more opaque, leading to probabilistic rather than definitive conclusions. This trade-off between complexity and explainability is the key theme illustrated.

In summary, the progression shows how data analysis methods grow more powerful yet less interpretable, requiring a balance between the depth of insights and the ability to understand and reliably apply the results.

KASLR(Kernel Address Space Layout Randomization)

With a Claude
this image of KASLR (Kernel Address Space Layout Randomization):

  1. Top Section:
  • Shows the traditional approach where the OS uses a Fixed kernel base memory address
  • Memory addresses are consistently located in the same position
  1. Bottom Section:
  • Demonstrates the KASLR-applied approach
  • The OS uses Randomized kernel base memory addresses
  1. Right Section (Components of Kernel Base Address):
  • “Kernel Region Code”: Area for kernel code
  • “Kernel Stack”: Area for kernel stack
  • “Virtual Memory mapping Area (vmalloc)”: Area for virtual memory mapping
  • “Module Area”: Where kernel modules are loaded
  • “Specific Memory Region”: Other specific memory regions
  1. Booting Time:
  • This is when the base addresses for kernel code, data, heap, stack, etc. are determined

The main purpose of KASLR is to enhance security. By randomizing the kernel’s memory addresses, it makes it more difficult for attackers to predict specific memory locations, thus preventing buffer overflow attacks and other memory-based exploits.

The diagram effectively shows the contrast between:

  • The traditional fixed-address approach (using a wrench symbol)
  • The KASLR approach (using dice to represent randomization)

Both approaches connect to RAM, but KASLR adds an important security layer through address randomization.

DAS / NAS / SAN

With a Claude
This image is a diagram comparing three major storage systems – DAS (Direct Access Storage), NAS (Network Access Storage), and SAN (Storage Network Array).

Let’s examine each system in detail:

  1. DAS (Direct Access Storage):
  • Direct storage system connected to the CPU
  • Shows direct connections between RAM and disk drives
  • Most basic storage architecture
  • Connected directly to the computer system
  1. NAS (Network Access Storage):
  • Storage accessible through the network
  • Marked with “Over The Network” indicating network connectivity
  • Consists of standalone storage units
  • Provides shared storage access through network
  1. SAN (Storage Network Array):
  • Most sophisticated and complex storage system
  • Features shown include:
    • High Speed Dedicated Network
    • Centralization Control
    • Block Storage
    • HA with RAID (High Availability with RAID)
    • Scale-out capabilities

The diagram effectively illustrates the evolution and increasing complexity of storage systems. It shows the progression from the simple direct-attached storage (DAS) through network-attached storage (NAS) to the more complex storage area network (SAN), with each iteration adding more sophisticated features and capabilities.

The layout of the diagram moves from left to right, demonstrating how each storage solution becomes more complex but also more capable, with SAN offering the most advanced features for enterprise-level storage needs.

Fast Copy over network

With a Claude
This image illustrates a system architecture diagram for “Fast Copy over network”. Here’s a detailed breakdown:

  1. Main Sections:
  • Fast Copy over network
  • Minimize Copy stacks
  • Minimize Computing
  • API optimization for read/write
  1. System Components:
  • Basic computing layer including OS (Operating System) and CPU
  • RAM (memory) layer
  • Hardware device layer
  1. Key Features:
  • The purple area on the left focuses on minimizing Count & Copy with API
  • The blue center area represents minimized computing works (Program Code)
  • The orange area on the right shows programmable API implementation
  1. Data Flow:
  • Arrows indicating bi-directional communication between systems
  • Vertical data flow from OS to RAM to hardware
  • Horizontal data exchange between systems

The architecture demonstrates a design aimed at optimizing data copying operations over networks while efficiently utilizing system resources.