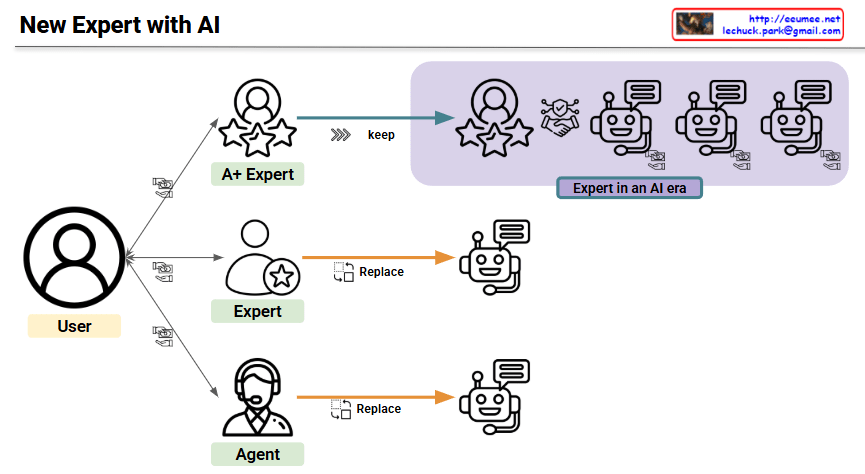
New Expert with AI

Diagram Overview

This diagram illustrates the structural transformation of the professional services market in the AI era.

Current Situation (Left Side)

Users pay for three levels of professional services:

  • A+ Expert: Top-tier expertise and specialized knowledge
  • Expert: Mid-level professional services
  • Agent: Basic professional task handling

AI Era Transformation (Right Side)

Market Polarization:

  • A+ Expert Retained: “keep” – Highest-level human expertise remains essential
  • Mid-tier Replacement: “Replace” – Expert and Agent roles substituted by AI systems
  • Cost Concentration: Payment structure shifts from 3 categories → 2 categories

Key Implications

  1. Economic Efficiency: Reduced costs for mid-tier professional services
  2. Market Polarization: Premium human experts vs. AI systems structure
  3. Enhanced Accessibility: Democratization of professional services through AI
  4. Structural Transformation: Fundamental reshaping of professional service industries

Economic Impact

  • Winners: A+ Experts (strengthened monopolistic position), AI service providers, general consumers
  • Disrupted: Mid-tier professionals (Expert and Agent levels)
  • Market Change: Structural reorganization and pricing transformation in professional services

Conclusion

This diagram effectively demonstrates not just job displacement, but the economic restructuring of professional service markets, showing how AI-driven substitution leads to cost structure changes and market bipolarization.

With Claude

Human in the loop : HITP

Human-in-the-Loop (HITL) System Diagram Analysis

Image Interpretation

Upper Section – Basic HITL Structure:

  • A three-stage process: Sensing → Analysis → Decision
  • Clear distinction between Machine Role and Human Role
  • Classified as a “Small Automation Step”

Lower Section – Real-world Complex Process:

  • Multiple HITL steps connected in a workflow pattern
  • Human intervention points (red “S” markers) at each stage labeled “It Also Human Role (Decision)”
  • Forms an overall “Real Big Process”
  • Complex structure with cyclical feedback loops

Key Concepts

This diagram illustrates not simple linear automation, but a collaborative system where humans and machines work together. It demonstrates that human judgment and intervention are required at each stage, and these small units combine to form larger business processes.

With Claude

Computing Changes with Power/Cooling

This chart compares power consumption and cooling requirements for server-grade computing hardware.

CPU Servers (Intel Xeon, AMD EPYC)

  • 1U-4U Rack: 0.2-1.2kW power consumption
  • 208V power supply
  • Standard air cooling (CRAC, server fans) sufficient
  • PUE: 1.4-1.6 (Power Usage Effectiveness)

GPU Servers (DGX Series)

Power consumption and cooling complexity increase dramatically:

Low-Power Models (DGX-1, DGX-2)

  • 3.5-10kW power consumption
  • Tesla V100 GPUs
  • High-performance air cooling required

Medium-Power Models (DGX A100, H100)

  • 6.5-10.2kW power consumption
  • 400V high voltage required
  • Liquid cooling recommended or essential

Highest-Performance Models (DGX B200, GB200)

  • 14.3-120kW extreme power consumption
  • Blackwell architecture GPUs
  • Full liquid cooling essential
  • PUE 1.1-1.2 with improved cooling efficiency

Key Trends Summary

The evolution from CPU to GPU computing represents a fundamental shift in data center infrastructure requirements. Power consumption scales dramatically from kilowatts to tens of kilowatts, driving the transition from traditional air cooling to sophisticated liquid cooling systems. Higher-performance systems paradoxically achieve better power efficiency through advanced cooling technologies, while requiring substantial infrastructure upgrades including high-voltage power delivery and comprehensive thermal management solutions.

※ Disclaimer: All figures presented in this chart are approximate reference values and may vary significantly depending on actual environmental conditions, workloads, configurations, ambient temperature, and other operational factors.

WIth Claude

Machine Changes

This image titled “Machine Changes” visually illustrates the evolution of technology and machinery across different eras.

The diagram progresses from left to right with arrows showing the developmental stages:

Stage 1 (Left): Manual Labor Era

  • Tool icons (wrench, spanner)
  • Hand icon
  • Worker icon Representing basic manual work using simple tools.

Stage 2: Mechanization Era

  • Manufacturing equipment and machinery
  • Power-driven machines Depicting the industrial revolution period with mechanized production.

Stage 3 (Blue section): Automation and Computer Era

  • Power supply systems
  • CPU/processor chips
  • Computer systems
  • Programming code Representing automation through electronics and computer technology.

Stage 4 (Purple section): AI and Smart Technology Era

  • Robots
  • GPU processors
  • Artificial brain/AI
  • Interactive interfaces Representing modern smart technology integrated with artificial intelligence and robotics.

Additional Insight: The transition from the CPU era to the GPU era marks a fundamental shift in what drives technological capability. In the CPU era, program logic was the critical factor – the sophistication of algorithms and code determined system performance. However, in the GPU era, training data has become paramount – the quality, quantity, and diversity of data used to train AI models now determines the intelligence and effectiveness of these systems. This represents a shift from logic-driven computation to data-driven learning.

Overall, this infographic captures humanity’s technological evolution: Manual Labor → Mechanization → Automation → AI/Robotics, highlighting how the foundation of technological advancement has evolved from human skill to mechanical power to programmed logic to data-driven intelligence.

With Claude

Personal(User/Expert) Data Service

System Overview

The Personal Data Service is an open expert RAG service platform based on MCP (Model Context Protocol). This system creates a bidirectional ecosystem where both users and experts can benefit mutually, enhancing accessibility to specialized knowledge and improving AI service quality.

Core Components

1. User Interface (Left Side)

  • LLM Model Selection: Users can choose their preferred language model or MoE (Mixture of Experts)
  • Expert Selection: Select domain-specific experts for customized responses
  • Prompt Input: Enter specific questions or requests

2. Open MCP Platform (Center)

  • Integrated Management Hub: Connects and coordinates all system components
  • Request Processing: Matches user requests with appropriate expert RAG systems
  • Service Orchestration: Manages and optimizes the entire workflow

3. LLM Service Layer (Right Side)

  • Multi-LLM Support: Integration with various AI model services
  • OAuth Authentication: Direct user selection of paid/free services
  • Vendor Neutrality: Open architecture independent of specific AI services

4. Expert RAG Ecosystem (Bottom)

  • Specialized Data Registration: Building expert-specific knowledge databases through RAG
  • Quality Management System: Ensuring reliability through evaluation and reputation management
  • Historical Logs: Continuous quality improvement through service usage records

Key Features

  1. Bidirectional Ecosystem: Users obtain expert answers while experts monetize their knowledge
  2. Open Architecture: Scalable platform based on MCP standards
  3. Quality Assurance: Expert and answer quality management through evaluation systems
  4. Flexible Integration: Compatibility with various LLM services
  5. Autonomous Operation: Direct data management and updates by experts

With Claude