Corpus, Ontology and LLM

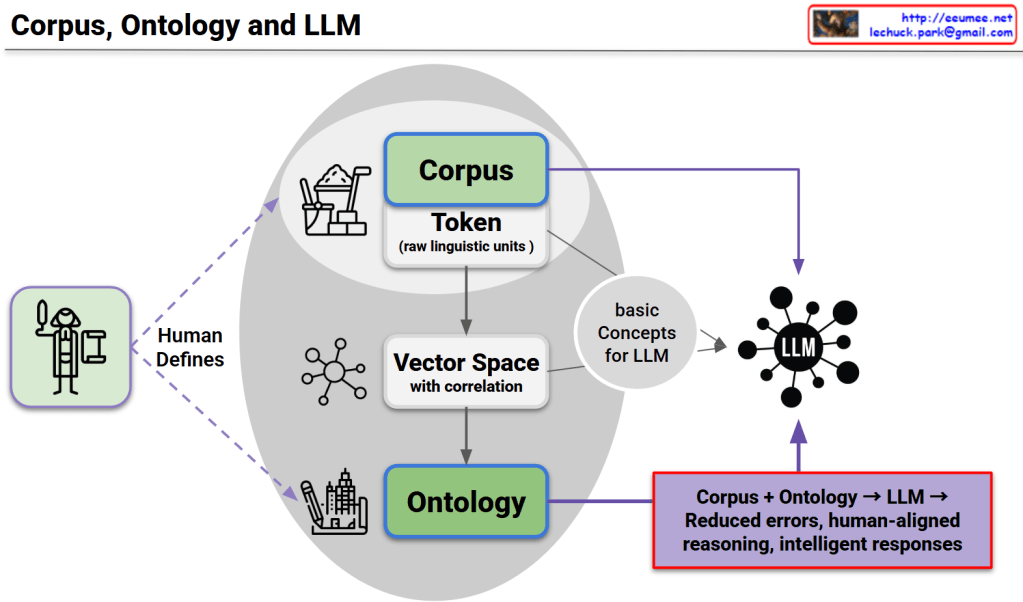
This diagram presents a unified framework consisting of three core structures, their interconnected relationships, and complementary utilization as the foundation for LLM advancement.

Three Core Structures

1. Corpus Structure

  • Token-based raw linguistic data
  • Provides statistical language patterns and usage frequency information

2. Ontology Structure

  • Systematically human-defined conceptual knowledge structure
  • Provides logical relationships and semantic hierarchies

3. LLM Structure

  • Neural network-based language processing model
  • Possesses pattern learning and generation capabilities

Interconnected Relationships and Interactions

  • Corpus → Vector Space: Numerical representation transformation of linguistic data
  • Ontology → Basic Concepts: Conceptual abstraction of structured knowledge
  • Vector Space ↔ Ontology: Mutual validation between statistical patterns and logical structures
  • Integrated Concepts → LLM: Multi-layered knowledge input

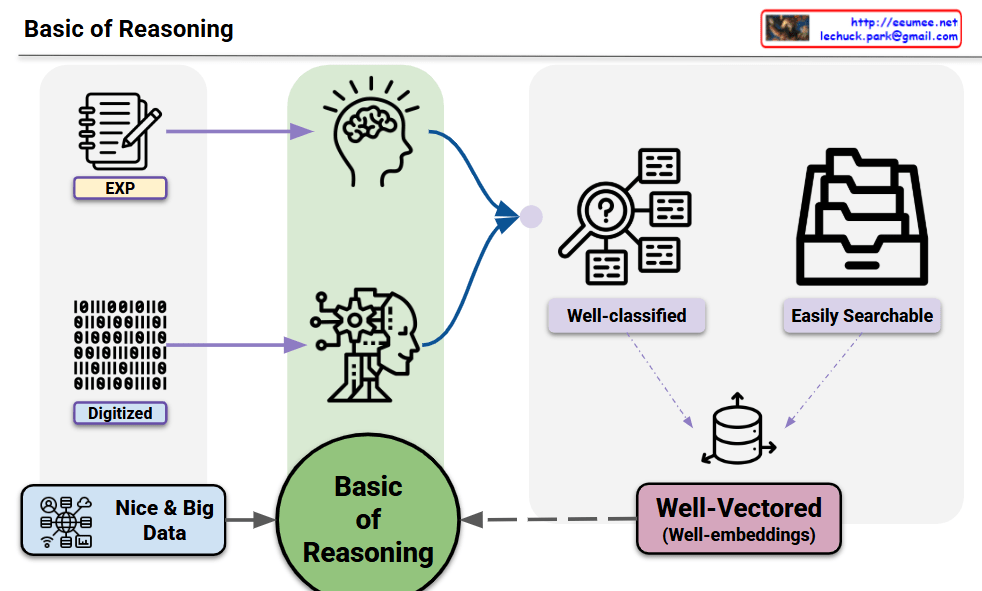
LLM Development Foundation through Complementary Relationships

Each structure compensates for the limitations of others:

  • Corpus’s statistical accuracy + Ontology’s logical consistency → Balanced knowledge foundation
  • Ontology’s explicit rules + LLM’s pattern learning → Flexible yet systematic reasoning
  • Corpus’s real-usage data + LLM’s generative capability → Natural and accurate language generation

Final Achievement

This triangular complementary structure overcomes the limitations of single approaches to achieve:

  • Error minimization
  • Human-centered reasoning capabilities
  • Intelligent and reliable response generation

This represents the core foundation for next-generation LLM development.

With Claude

Basic of Reasoning

This diagram illustrates that human reasoning and AI reasoning share fundamentally identical structures.

Key Insights:

Common Structure Between Human and AI:

  • Human Experience (EXP) = Digitized Data: Human experiential knowledge and AI’s digital data are essentially the same information in different representations
  • Both rely on high-quality, large-scale data (Nice & Big Data) as their foundation

Shared Processing Pipeline:

  • Both human brain (intuitive thinking) and AI (systematic processing) go through the same Basic of Reasoning process
  • Information gets well-classified and structured to be easily searchable
  • Finally transformed into well-vectorized embeddings for storage

Essential Components for Reasoning:

  1. Quality Data: Whether experience or digital information, sufficient and high-quality data is crucial
  2. Structure: Systematic classification and organization of information
  3. Vectorization: Conversion into searchable and associative formats

Summary: This diagram demonstrates that effective reasoning – whether human or artificial – requires the same fundamental components: quality data and well-structured, vectorized representations. The core insight is that human experiential learning and AI data processing follow identical patterns, both culminating in structured knowledge storage that enables effective reasoning and retrieval.

“Vectors” than definitions.

This image visualizes the core philosophy that “In the AI era, vector-based thinking is needed rather than simplified definitions.”

Paradigm Shift in the Upper Flow:

  • Definitions: Traditional linear and fixed textual definitions
  • Vector: Transformation into multidimensional and flexible vector space
  • Context: Structure where clustering and contextual relationships emerge through vectorization

Modern Approach in the Lower Flow:

  1. Big Data: Complex and diverse forms of data
  2. Machine Learning: Processing through pattern recognition and learning
  3. Classification: Sophisticated vector-based classification
  4. Clustered: Clustering based on semantic similarity
  5. Labeling: Dynamic labeling considering context

Core Insight: In the AI era, we must move beyond simplistic definitional thinking like “an apple is a red fruit” and understand an apple as a multidimensional vector encompassing color, taste, texture, nutritional content, cultural meaning, and more. This vector-based thinking enables richer contextual understanding and flexible reasoning, allowing us to solve complex real-world problems more effectively.

Beyond simple classification or definition, this presents a new cognitive paradigm that emphasizes relationships and context. The image advocates for a fundamental shift from rigid categorical thinking to a nuanced, multidimensional understanding that better reflects how modern AI systems process and interpret information.

With Claude

Think by a Vector

This image presents a concept titled “Think by a Vector” that compares two approaches to handling data.

The image shows a data processing flow starting from what appears to be a network or system diagram on the left, which outputs binary data (represented as 0s and 1s) labeled as “Data Explosion.” This data can then be processed in two different ways:

  1. Raster approach (top path):
    • Labeled as “Checking All data one by one”
    • Described as “Impossible to handle all data”
    • Represented by squares/pixels, suggesting pixel-by-pixel processing
  2. Vector approach (bottom path):
    • Labeled as “Extract Features”
    • Uses “prediction with Features”
    • Includes text stating “must apply the perfect basic rules (Feature)”
    • Represented by a node/vector diagram showing connected points

The main message appears to be advocating for vector-based thinking or processing, which focuses on extracting and working with key features rather than processing every individual data point. This approach is presented as more efficient and effective than the raster-based approach.

With Claude

Vector

From Claude with some prompting
This image illustrates the vectorization process in three key stages.

  1. Input Data Characteristics (Left):
  • Feature: Original data characteristics
  • Numbers: Quantified information
  • countable: Discrete and clearly distinguishable data → This stage represents observable data from the real world.
  1. Transformation Process (Center):
  • Pattern: Captures regularities and recurring characteristics in data
  • Changes: Dynamic aspects and transformation of data → This represents the intermediate processing stage where raw data is transformed into vectors.
  1. Output (Right):
  • Vector: Final form transformed into a mathematical representation
  • math formula: Mathematically formalized expression
  • uncountable: State transformed into continuous space → Shown in 3D coordinate system, demonstrating the possibility of abstract data representation.

Key Insights:

  1. Data Abstraction:
  • Shows the process of converting concrete, countable data into abstract, continuous forms
  • Demonstrates the transition from discrete to continuous representation
  1. Dimensional Transformation:
  • Explains how individual features are integrated and mapped into a vector space
  • Shows the unification of separate characteristics into a cohesive mathematical form
  1. Application Areas:
  • Feature extraction in machine learning
  • Data dimensionality reduction
  • Pattern recognition
  • Word embeddings in Natural Language Processing
  • Image processing in Computer Vision
  1. Benefits:
  • Efficient processing of complex data
  • Easy application of mathematical operations
  • Discovery of relationships and patterns between data points
  • Direct applicability to machine learning algorithms
  1. Technical Implications:
  • Enables mathematical manipulation of real-world data
  • Facilitates computational processing
  • Supports advanced analytical methods
  • Enables similarity measurements between data points

This vectorization process serves as a fundamental preprocessing step in modern data science and artificial intelligence, transforming raw, observable features into mathematically tractable forms that algorithms can effectively process.

The progression from countable features to uncountable vector representations demonstrates the power of mathematical abstraction in handling complex, real-world data structures.

Raster(pixel) vs Vector

From Claude with some prompting
This image compares raster (pixel) and vector graphics. On the left, there are two pixel-based images showing simple shapes. In the middle, there is a grid representing pixel data, with 0s and 1s likely indicating whether each pixel is on or off.

On the right side, there is a vector graphic representation of a line, which is defined by attributes like length, direction angle, and starting location coordinates. Vector graphics can be resized and zoomed smoothly without losing quality, as illustrated by the zoomed-in vector line on the far right.

The key difference highlighted is that raster images are composed of individual pixels, while vector graphics are based on mathematical equations defining shapes and lines, allowing for smooth scaling and rendering at any resolution. This comparison helps understand the fundamental differences between these two common digital graphic formats and their respective strengths.

CPU & GPU Works

From Claude with some prompting
This image explains the working principles of CPU (Central Processing Unit) and GPU (Graphics Processing Unit) in a visual manner.

  1. Data Types:
    • Scalar: A single value
    • Vector: One-dimensional array
    • Matrix: Two-dimensional array
    • Tensor: Multi-dimensional array
  2. CPU Work Method:
    • Sequential processing, denoted by ’01’
    • Tasks are processed in order, as shown by 1, 2, 3, 4, 5
    • Primarily handles scalar data, processing complex tasks sequentially
  3. GPU Work Method:
    • Parallel processing, represented by a matrix
    • Icons show multiple tasks being processed simultaneously
    • Mainly deals with multi-dimensional data like matrices or tensors, processing many tasks in parallel

The image demonstrates that while CPUs process tasks sequentially, GPUs can handle many tasks simultaneously in parallel. This helps explain which processing unit is more efficient based on the complexity and volume of data. Complex and large-scale data (matrices, tensors) are better suited for GPUs, while simple, sequential tasks are more appropriate for CPUs.