New Infra Age

From Claude with some prompting
This diagram illustrates the cyclical evolution of computing infrastructure, emphasizing the re-entry into a new computing infrastructure era driven by AI technology:

  1. Development cycle:
    • Traditional infrastructure era (Infra age) → Software era (SW Age) → New infrastructure era (New Infra age)
  2. Core elements of the new infrastructure era:
    • AI/ML (highlighted with red circles): Processing humanity’s accumulated experiences and data
    • GPU: Key computing infrastructure for AI
  3. Driving forces of development:
    • More Users
    • More Data
    • These are visualized by the icons at the bottom
  4. Key connection points (highlighted with red circles):
    • PC: Increased user base due to personal computer proliferation
    • Internet: Enhanced global connectivity
    • Web: Improved information accessibility
    • Mobile: Anytime, anywhere access environment
    • AI/ML: Processing and utilization of accumulated data
  5. Cyclical development:
    • User increase → Data increase → Infrastructure development to process this data → Attraction of more users, creating a cyclical structure

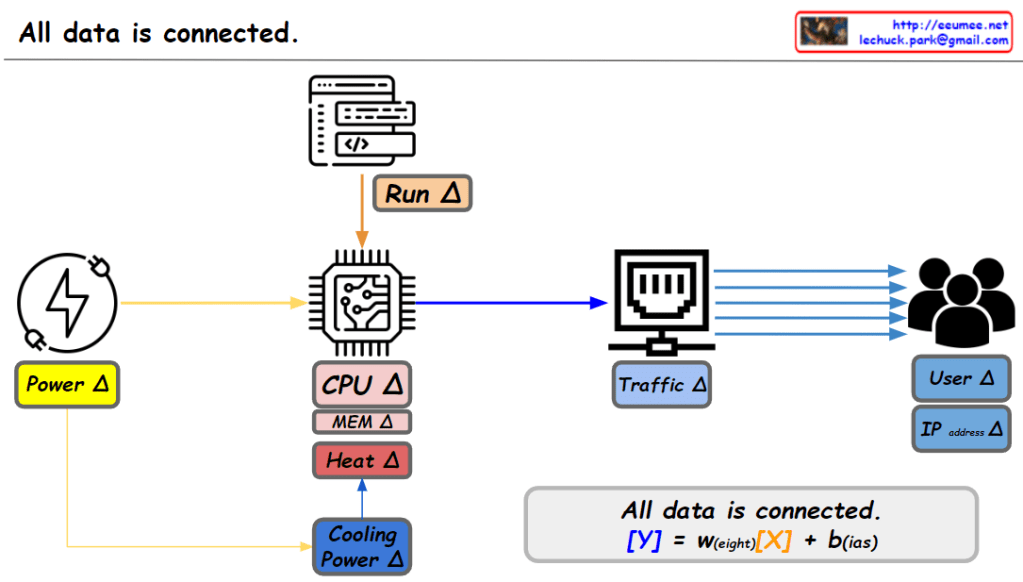
This diagram emphasizes that as AI technology begins to comprehensively process and utilize humanity’s accumulated experiences and data, it necessitates the expansion of new GPU-centric computing infrastructure to support this. It demonstrates a cyclical structure where processing more users and data leads to further infrastructure development, which in turn enables handling even more users and data.

New OS

From Claude with some prompting
This image illustrates a more comprehensive structure of a new operating system integrated with AI. Here’s a summary of the key changes and features:

  1. Cloud Connectivity: A “Cloud Connected” element has been added, linked to AI Applications. This represents the integration between local AI and cloud-based AI services.
  2. User Data Protection: The “User Data (Private)” section now includes various icons, visualizing the management of different types of user data and emphasizing privacy protection.
  3. New Interface: The Q&A-style “New Interface” is more prominently displayed, highlighting direct interaction between AI and users.
  4. AI Application Integration: AI Applications are closely connected to User Applications, the Inference Model, and User Data.
  5. Hardware Utilization: The GPU (inference) is clearly marked as specialized hardware for AI tasks.
  6. Localized Learning Data: “Learned Data (Localized)” is included as part of the system, indicating the capability to provide personalized AI experiences.

This structure offers several advantages:

  • Enhanced User Experience: Intuitive interaction through AI-based interfaces
  • Privacy Protection: Secure management of user data
  • Hybrid Cloud-Local AI: Balanced use of local processing and cloud resources
  • Performance Optimization: Efficient AI task processing through GPU
  • Personalization: Customized AI services using localized learning data

This new OS architecture integrates AI as a core component, seamlessly combining traditional OS functions with advanced AI capabilities to present a next-generation computing environment.

Framework & Platform

From Claude with some prompting
Summary:

  1. General Work:
    • Simple producer-product-user relationship
  2. Framework:
    • Provides structure and workflow optimized for specific domains
    • Efficiently produces consistent quality products
    • Producer-centric, users primarily consumers
  3. Platform:
    • Offers a broad ecosystem
    • Users can act as prosumers
    • Enables creation of diverse and extensive products
    • Facilitates complex interactions and network effects

Key Differences:

  • Framework focuses on efficiency and consistency
  • Platform emphasizes diversity, scalability, and user engagement
  • Framework applies to specific domains, Platform to broad areas
  • Platform allows for more diverse and active user roles

Framework is about streamlining production within defined boundaries, while Platform creates an environment for diverse creation and interaction.

All data is connected

from DALL-E with some prompting
This image illustrates that key metrics generated from computing activities (such as power, CPU performance, memory usage, heat, and cooling power), data traffic, and user behavior (e.g., IP addresses) are interconnected. These metrics influence one another and their interactions can provide insights into the overall state of the system. The linear regression equation at the bottom of the image represents a simple mathematical model for analyzing and predicting the relationships between these metrics, suggesting how they can be numerically understood and connected.