Data Center Mgt. System Req.

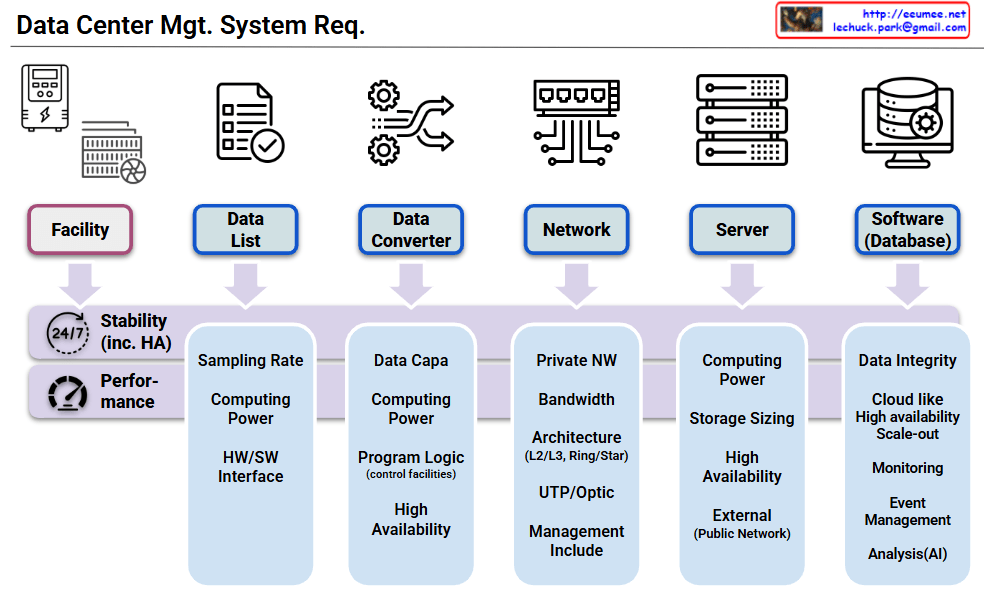
System Components (Top Level)

Six core components:

  • Facility: Data center physical infrastructure
  • Data List: Data management and cataloging
  • Data Converter: Data format conversion
  • Network: Network infrastructure
  • Server: Server hardware
  • Software (Database): Applications and database systems

Universal Mandatory Requirements

Fundamental requirements applied to ALL components:

  • Stability (24/7 HA): 24/7 High Availability – All systems must operate continuously without interruption
  • Performance: Optimal performance assurance – All components must meet required performance levels

Component-Specific Additional Requirements

1. Data List

  • Sampling Rate, Computing Power, HW/SW Interface

2. Data Converter

  • Data Capacity, Computing Power, Program Logic (control facilities), High Availability

3. Network

  • Private NW, Bandwidth, Architecture (L2/L3, Ring/Star), UTP/Optic, Management Include

4. Server

  • Computing Power, Storage Sizing, High Availability, External (Public Network)

5. Software/Database

  • Data Integrity, Cloud-like High Availability & Scale-out, Monitoring, Event Management, Analysis (AI)

This architecture emphasizes that stability and performance are fundamental prerequisites for data center operations, with each component having its own specific additional requirements built upon these two essential foundation requirements.

With Claude

Operating with a dev Platform

with a Claude’s help
The main points covered in this image are:

  1. Increased Size and Complexity of Data
  • The central upward-pointing arrow indicates that the size and complexity of data is increasing.
  1. Key Operational Objectives
  • The three main operational goals presented are Stability, Efficiency, and an “Unchangeable Objective”.
  • Stability is represented by the 24/7 icon, indicating the need for continuous, reliable operation.
  • Efficiency is depicted through various electrical/mechanical icons, suggesting the need for optimized resource utilization.
  • The “Unchangeable Objective” is presented as a non-negotiable goal.
  1. Integration, Digital Twin, and AI-based Development Platform
  • To manage the increasing data and operations, the image shows the integration of technologies like Digital Twin.
  • An AI-powered Development Platform is also illustrated, which can “make it [the operations] itself with experience”.
  • This Development Platform seems to leverage AI to help achieve the stability, efficiency, and unchangeable objectives.
  1. Interconnected Elements
  • The image demonstrates the interconnected nature of the growing data, the key operational requirements, and the technological solutions.
  • The Development Platform acts as a hub, integrating data and AI capabilities to support the overall operational goals.

In summary, this image highlights the challenges posed by the increased size and complexity of data that organizations need to manage. It presents the core operational objectives of stability, efficiency, and immutable goals, and suggests that an integrated, AI-powered development platform can help address these challenges by leveraging the synergies between data, digital technologies, and autonomous problem-solving capabilities.

Stability + Efficiency = Optimization

From Claude with some prompting
This image illustrates the concept of optimization, which is achieved through a balance between stability and efficiency.

  1. Stability:
    • Represented by the 24-hour clock icon, this refers to the consistency and reliability of a system over time.
  2. Efficiency:
    • Depicted by the gear/dollar sign icon, this represents the ability to maximize output or performance with minimal resources.
  3. Trade-off:
    • The central element shows the conflicting relationship between stability and efficiency.
    • Humans struggle to achieve both stability and efficiency simultaneously.
  4. Programmatic Automation:
    • The system icon suggests that automation or programmatic control can enable a “win-win” scenario, where both stability and efficiency can be optimized.
    • Systems have the capability to overcome the “trade-off” tendency that humans often exhibit.
  5. Optimization:
    • Represented by the gear and chart icon, this is the final, optimized state achieved through the balance of stability and efficiency.
    • By combining the human “trade-off” tendency and the system’s “win-win” capability, a more integrated optimization can be attained.

In summary, this image contrasts the differences between human and system approaches in the pursuit of optimization. By leveraging the strengths of both, the optimal balance between stability and efficiency can be achieved.

Before & Optimization

From Claude with some prompting
This image illustrates the process of “Before & Optimization” in a system, divided into three main stages:

  1. Initial State:
    • Shows “Supply” and “Usage” components.
    • Demonstrates a stable supply flowing to usage.
    • The graph indicates supply maintaining slightly above usage.
  2. Intermediate Stage:
    • Introduces “Redundancy (High Availability)”.
    • An additional supply unit labeled “One More Ready” is added.
    • The “Stability” graph shows supply consistently higher than usage, with the note “Maintain Supply > Usage”.
  3. Final Optimization Stage:
    • The “Optimization” graph shows supply and usage being closely aligned.
    • Purple arrows indicate adjustments to match supply with usage.
    • Labeled “Goto Supply = Usage”, showing the goal of matching supply to usage.

Overall, this image depicts the progression from ensuring stable supply, through adding redundancy for increased stability, to finally optimizing the system by matching supply closely with usage. It demonstrates the process of maintaining system stability while improving efficiency.

Server Room Stability & Optimization

From Claude with some prompting
Server Room Stability & Optimization

  1. Cooling Supply: Ensuring sufficient cooling capacity to effectively dissipate the heat generated by the servers
  2. Power Usage: Monitoring and managing the power consumption of the servers
  3. Power Supply: Maintaining a stable and reliable power supply to the server room
  4. Resource Check:
    • Power Resource: Verifying the ability to provide the necessary power supply for the server usage
    • Cooling Resource: Checking the cooling capacity to effectively handle the heat generated by the servers
  5. Anomaly Detection: Identifying any anomalies or unusual patterns in the server room’s behavior
  6. Stability: Maintaining the power and cooling resource supply to meet or exceed the server usage requirements
  7. Optimizing: Based on the stability analysis, optimizing the power and cooling resource supply to match the server usage

The key focus is on the appropriate management and provisioning of both power and cooling resources to ensure the overall stability and optimization of the server room operations.

By Software System

From Claude with some prompting
This image illustrates the improvement of work processes through a software system. It’s divided into two parts, with the left side showing manual work and the right side depicting work done through a software system.

Left side (Manual):

  1. Work: Represented by a wrench icon
  2. Process: Shown as a flowchart-like icon
  3. Stability and Efficiency are shown in a trade-off relationship with arrows

Right side (Software System):

  1. Automation: Depicted by a rotating gear icon
  2. Optimization: Represented by an ascending graph icon
  3. Long Jump: Shown with a clock and hourglass icon
    • Described as “Get great results over a long period of time”
  4. Both Stability and Efficiency are shown to increase with upward arrows

The image demonstrates that implementing a software system can simultaneously improve stability and efficiency, and through automation and optimization, achieve significant long-term results.

This diagram effectively contrasts the limitations of manual processes with the benefits of implementing a software system for work processes.