Power Usage of Cooling

Data Center Cooling System Power Usage Analysis

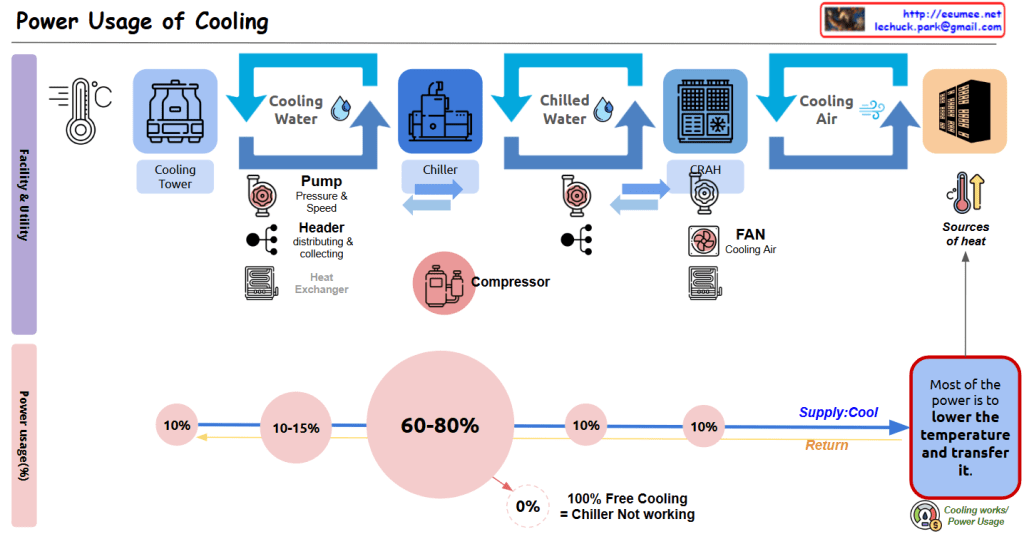
This diagram illustrates the cooling system configuration of a data center and the power consumption proportions of each component.

Cooling Facility Stages:

  1. Cooling Tower: The first stage, generating Cooling Water through contact between outside air and water.
  2. Chiller: Receives cooling water and converts it to Chilled Water at a lower temperature through the compressor.
  3. CRAH (Computer Room Air Handler): Uses chilled water to produce Cooling Air for the server room.
  4. Server Rack Cooling: Finally, cooling air reaches the server racks and absorbs heat.

Several auxiliary devices operate in this process:

  • Pump: Regulates the pressure and speed of cooling water and chilled water.
  • Header: Efficiently distributes and collects water.
  • Heat Exchanger: Optimizes the heat transfer process.
  • Fan: Circulates cooling air.

Cooling Facility Power Usage Proportions:

  • Chiller/Compressor: The largest power consumer, accounting for 60-80% of total cooling power.
  • Pump: Consumes 10-15% of power.
  • Cooling Tower: Uses approximately 10% of power.
  • CRAH/Fan: Uses approximately 10% of power.
  • Other components: Account for the remaining 10%.

Purpose of Energy Usage (Efficiency):

  • As indicated in the blue box on the lower right, “Most of the power is to lower the temperature and transfer it.”
  • The system operates through Supply and Return loops to remove heat from the “Sources of heat.”
  • The note “100% Free Cooling = Chiller Not working” indicates that when using natural cooling methods, the most power-intensive component (the chiller) doesn’t need to operate, potentially resulting in significant energy efficiency improvements.

This data center cooling system diagram illustrates how cooling moves from Cooling Tower to Chiller to CRAH to server racks, with compressors consuming the majority (60-80%) of power usage, followed by pumps (10-15%) and other components (10% each). The system primarily functions to lower temperatures and transfer heat, with the important insight that 100% free cooling eliminates the need for chillers, potentially saving significant energy.

With Claude

Power Flow

Power Flow Diagram Analysis

This image illustrates a power flow diagram for a data center or server room, showing the sequential path of electricity from external power sources to the final server equipment.

Main Components:

  1. Intake: External power supply at 154 kV / 22.9 kV with 100MW(MVA) capacity
  2. Transformer: Performs voltage conversion (step down) to make power easier to handle
  3. Generator: Provides backup power during outages, connected to a fuel tank
  4. Transformer #2: Second voltage conversion, bringing power closer to usable voltage (220/380V)
  5. UPS/Battery: Uninterruptible Power Supply with battery backup for blackout protection, showing capacity (KVA) and backup time
  6. PDU/TOB: Power Distribution Unit for connecting to servers
  7. Server: Final power consumption equipment

Key Features:

  • Red circles indicate power switching/distribution points
  • Dotted lines show backup power connections
  • The bottom section details the characteristics of each component:
    • Intake power specifications
    • Voltage conversion information
    • Blackout readiness status
    • Server connection details
    • Power usage status

Summary:

This diagram represents the complete power infrastructure of a data center, illustrating how electricity flows from the grid through multiple transformation and backup systems before reaching the servers. It demonstrates the redundancy measures implemented to ensure continuous operation during power outages, including generators and UPS systems. The power path includes necessary voltage step-down transformations to convert high-voltage grid power to server-appropriate voltages, with switching and distribution points throughout the system. This comprehensive power flow design ensures reliable, uninterrupted power delivery critical for data center operations.

With Claude

AI in the data center

AI in the Data Center

This diagram titled “AI in the Data Center” illustrates two key transformational elements that occur when AI technology is integrated into data centers:

1. Computing Infrastructure Changes

  • AI workloads powered by GPUs become central to operations
  • Transition from traditional server infrastructure to GPU-centric computing architecture
  • Fundamental changes in data center hardware configuration and network connectivity

2. Management Infrastructure Changes

  • Increased requirements for power (“More Power!!”) and cooling (“More Cooling!!”) to support GPU infrastructure
  • Implementation of data-driven management systems utilizing AI technology
  • AI-based analytics and management for maintaining stability and improving efficiency

These two changes are interconnected, visually demonstrating how AI technology not only revolutionizes the computing capabilities of data centers but also necessitates innovation in management approaches to effectively operate these advanced systems.

with Claude

Add with power

Add with Power: 8-Bit Binary Addition and Energy Transformation

Core Mechanism:

  1. Input: Two 8-energy binary states (both rows ending with 1)
  2. Computation Process: 1+1 = 2 (binary overflow occurs)
  3. Result:
    • Output row’s last bit changed to 0
    • Part of energy converted to heat

Key Components:

  • Two input rows with 8 binary “energies”
  • Computing symbol (+) representing addition
  • A heat generation (?) box marked x8
  • Resulting output row with modified energy state

Fundamental Principle: “All energies must be maintained with continuous energies for no error (no changes without Computing)”

This diagram illustrates:

  • Binary addition process
  • Energy conservation and transformation
  • Information loss during computation
  • Relationship between computation, energy, and heat generation

The visual representation shows how a simple 8-bit addition triggers energy transfer, with overflow resulting in heat production and a modified binary state.

WIth Claude

Server Room Cooling Metrics

This dashboard is designed to monitor the comprehensive performance of server room cooling systems by displaying temperature changes alongside server power consumption data, while also tracking water flow rate (Water LPM) and fan speed. The main utilities and applications of this approach include:

  1. Integrated Data Visualization:
    • Enables simultaneous monitoring of temperature, power consumption, and cooling system parameters (flow rate, fan speed) in a single dashboard, facilitating the identification of correlations between systems.
    • Allows operators to immediately observe how increases in power consumption lead to temperature rises and the subsequent response of cooling systems.
  2. Benefits of Heat Map Implementation:
    • Represents data from multiple temperature sensors categorized as MAX/MIN/AVG with color differentiation, providing intuitive understanding of spatial temperature distribution.
    • Creates clear visual contrast between yellow (HOTZONE) and blue (COOLZONE) areas, making temperature gradients easily recognizable.
    • Enables quick identification of temperature anomalies for early detection of potential issues.
  3. Cooling Efficiency Monitoring:
    • Facilitates analysis of the relationship between Water LPM (water flow rate) and temperature changes to evaluate cooling water usage efficiency.
    • Allows assessment of air circulation system effectiveness by examining correlations between fan speed and COOLZONE/HOTZONE temperature changes.
    • Enables real-time monitoring of heat exchange efficiency through the difference between RETURN TEMP and SUPPLY TEMP.
  4. Event Detection and Analysis:
    • Features an “EVENT(Big Change?)” indicator that helps quickly identify significant changes or anomalies.
    • Displays data from the past 30 minutes in 5-minute intervals, enabling analysis of short-term trends and patterns.
  5. Operational Decision Support:
    • Provides immediate feedback on the effects of cooling system adjustments (changes in flow rate or fan speed) on temperature, enabling optimization of operational parameters.
    • Helps evaluate the response capability of cooling systems during increased server loads, supporting capacity planning.
    • Offers necessary data to balance energy efficiency with server stability.

This dashboard goes beyond a simple monitoring tool to serve as a comprehensive decision support system for optimizing thermal management in server rooms, improving energy efficiency, and ensuring equipment stability. The heat map visualization approach, in particular, makes complex temperature data intuitively interpretable, allowing operators to quickly assess situations and respond appropriately.

With Claude

Power Control

Power Control system diagram

  1. Power Source (Left Side)
  • High Power characteristics:
    • Very Dangerous
    • Very Difficult to Control
    • High Cost to Control
  1. Central Control/Distribution System (Center)
  • Distributor: Shares/distributes power
  • Transformer: Steps down power
  • Circuit Breaker: Stops power
  • UPS (Uninterruptible Power Supply): Saves power
  • Power Control (multi-step)
  1. Final Distribution (Right Side)
  • Low Power characteristics:
    • Power for computing
    • Complex Control Required
    • Reduced dangers

The diagram shows the complete process of how high-power electricity is safely and efficiently controlled and converted into low-power suitable for computing systems. The power flow is illustrated through a “Delivery” phase, passing through various protective and control devices before being distributed to multiple servers or computing equipment.

The system emphasizes safety and control through multiple stages:

  • Initial high-power input is marked as dangerous and difficult to control
  • Multiple control mechanisms (transformer, circuit breaker, UPS) manage the power
  • The distributor splits the controlled power to multiple endpoints
  • Final output is appropriate for computing equipment

This setup ensures safe and reliable power distribution while reducing the risks associated with high-power electrical systems.

With Claude

Data Center Supply

With Claude
The supply system in data centers follows a unified control flow pattern of “Change → Distribute → Block”. This pattern is consistently applied across all core infrastructure elements (Traffic, Power, and Cooling). Let’s examine each stage and its applications:

1. Change Stage

  • Transforms incoming resources into forms suitable for the system
  • Traffic: Protocol/bandwidth conversion through routers
  • Power: Voltage/current conversion through transformers/UPS
  • Cooling: Temperature conversion through chillers/heat exchangers

2. Distribute Stage

  • Efficiently distributes converted resources where needed
  • Traffic: Network load distribution through switches and load balancers
  • Power: Power distribution through distribution boards and bus ducts
  • Cooling: Cooling air/water distribution through ducts/piping/dampers

3. Block Stage

  • Ensures system protection and security
  • Traffic: Security threat prevention through firewalls/IPS/IDS
  • Power: Overload protection through circuit breakers and fuses
  • Cooling: Backflow prevention through shutoff valves and dampers

Benefits of this unified approach:

  1. Ensures consistency in system design
  2. Increases operational management efficiency
  3. Enables quick problem identification
  4. Improves scalability and maintenance

Detailed breakdown by domain:

Traffic Management

  • Change: Router gateways (Protocol/Bandwidth)
  • Distribute: Switch/L2/L3, Load Balancer
  • Block: Firewall, IPS/IDS, ACL Switch

Power Management

  • Change: Transformer, UPS (Voltage/Current/AC-DC)
  • Distribute: Distribution boards/bus ducts
  • Block: Circuit breakers (MCCB/ACB), ELB, Fuses

Cooling Management

  • Change: Chillers/Heat exchangers (Water→Air)
  • Distribute: Ducts/Piping/Dampers
  • Block: Backflow prevention/isolation/fire dampers, shutoff valves

This structure enables systematic and efficient operation of complex data center infrastructure by managing the three critical supply elements (Traffic, Power, Cooling) within the same framework. Each component plays a specific role in ensuring the reliable and secure operation of the data center, while maintaining consistency across different systems.