From Claude with some prompting
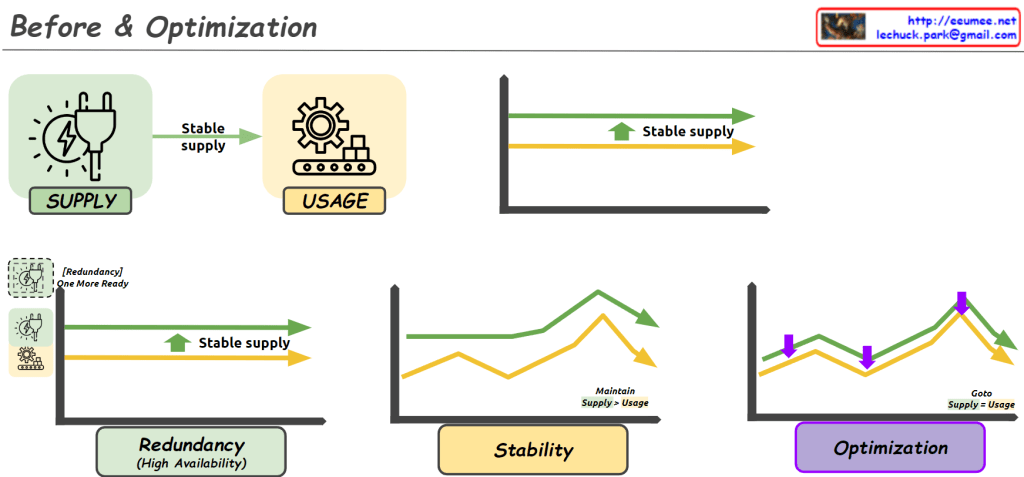
This image illustrates the process of “Before & Optimization” in a system, divided into three main stages:
- Initial State:
- Shows “Supply” and “Usage” components.
- Demonstrates a stable supply flowing to usage.
- The graph indicates supply maintaining slightly above usage.
- Intermediate Stage:
- Introduces “Redundancy (High Availability)”.
- An additional supply unit labeled “One More Ready” is added.
- The “Stability” graph shows supply consistently higher than usage, with the note “Maintain Supply > Usage”.
- Final Optimization Stage:
- The “Optimization” graph shows supply and usage being closely aligned.
- Purple arrows indicate adjustments to match supply with usage.
- Labeled “Goto Supply = Usage”, showing the goal of matching supply to usage.
Overall, this image depicts the progression from ensuring stable supply, through adding redundancy for increased stability, to finally optimizing the system by matching supply closely with usage. It demonstrates the process of maintaining system stability while improving efficiency.