Operation with LLM

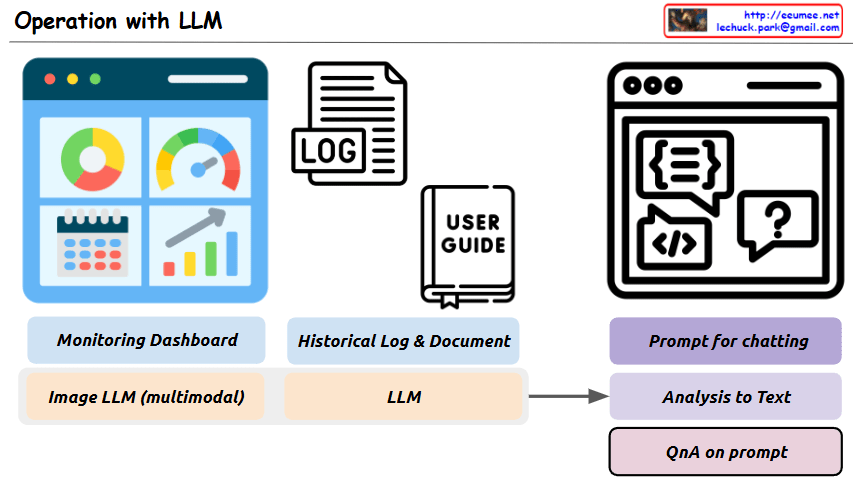
This image is a diagram titled “Operation with LLM,” showing a system architecture that integrates Large Language Models (LLMs) with existing operational technologies.

The main purpose of this system is to more efficiently analyze and solve various operational data and situations using LLMs.

Key components and functions:

  1. Top Left: “Monitoring Dashboard” – Provides an environment where LLMs can interpret image data collected from monitoring screens.
  2. Top Center: “Historical Log & Document” – LLMs analyze system log files and organize related processes from user manuals.
  3. Top Right: “Prompt for chatting” – An interface for interacting with LLMs through appropriate prompts.
  4. Bottom Left: “Image LLM (multimodal)” – Represents multimodal LLM functionality for interpreting images from monitoring screens.
  5. Bottom Center: “LLM” – The core language model component that processes text-based logs and documents.
  6. Bottom Right:
    • “Analysis to Text” – LLMs analyze various input sources and convert them to text
    • “QnA on prompt” – Users can ask questions about problem situations, and LLMs provide answers

This system aims to build an integrated operational environment where problems occurring in operational settings can be easily analyzed through LLM prompting and efficiently solved through a question-answer format.

With Claude

Software Defined Power Distribution

With a Claude
the Software Defined Power Distribution (SDPD) system, including the added standards and protocols shown in the image:

  1. SDN Similarity
  • Like Software-Defined Networking controls network traffic, SDPD applies similar software-defined principles to power distribution
  1. Key Components
  • Real-time Monitoring: Power consumption and system status analysis using IoT sensors and AI
  • Centralized Control: Power distribution optimization through an integrated platform
  • Flexibility/Scalability: Software-based upgrades and expansion
  • Energy Efficiency: Data center power optimization and rapid fault response
  1. Standards and Protocols
  • IEC 61850: Substation automation communication standard
  • IEEE 2030.5: Smart energy profile standard
  • Modbus/DNP3: Industrial communication protocols
  • OpenADR: Automated demand response standard

Final Summary: Why Software Defined X (SDx) is necessary for power distribution

  • Modern power systems face increasing complexity and require real-time response capabilities
  • Data-driven decision making and automated control are essential
  • Software Defined approach (SDPD) provides:
    1. Real-time data collection/analysis for optimized power flow
    2. Rapid response and efficient management through centralized control
    3. Flexible system expansion and upgrades through software-based architecture
    4. Achievement of improved energy efficiency and reduced operational costs

The software-defined approach has become essential in the power sector, just as it has in networking, because it enables:

  • Intelligent resource allocation
  • Improved system visibility
  • Enhanced operational efficiency
  • Better fault tolerance and recovery
  • Cost-effective scaling and updates

This demonstrates why a data-centric, software-defined approach is crucial for modern power systems to achieve efficiency, reliability, and scalability.

log with the LLM

From Claude with some prompting
This image represents an “Alarm log with the LLM” system. The key components and functionality are as follows:

  1. NMS (Network Management System): A monitoring system that collects and displays alarm data.
  2. Text-based Event-driven Syslog: A system that logs events and alarm data in real-time text format. Syslog provides immediate data that is easily collected from existing environments.
  3. DCIM (Data Center Infrastructure Management): A system that manages the physical infrastructure of a data center, including alarms and monitoring.
  4. AI: An artificial intelligence component that utilizes a Large Language Model (LLM) for learning.
  5. 1-minute alarm analysis results and solutions: From a real-time monitoring perspective, this analyzes immediate alarm situations and provides solutions.
  6. 1-month alarm analysis: This long-term analysis of alarm data identifies anticipated problems. The analysis results can be used to provide a chatbot-based status query and response environment.

Overall, this system can provide powerful alarm management capabilities through real-time monitoring and predictive analysis.

Changes -> Process

From Claude with some prompting
The diagram titled “Changes and Process” illustrates an organization’s system for detecting and responding to changes. The key components and flow are as follows:

  1. 24-Hour Working System:
    • Represented by a 24-hour clock icon and a checklist icon.
    • This indicates continuous monitoring and operation.
  2. Change Detection:
    • Depicted by a gear icon positioned centrally.
    • Captures changes occurring within the 24-hour working system.
  3. Monitoring:
    • Shown as a magnifying glass icon.
    • Closely observes and analyzes detected changes.
  4. Alert System:
    • Represented by an exclamation mark icon.
    • Signals important changes or issues that require attention.
  5. Response Process:
    • Illustrated as a flowchart with multiple stages.
    • Initiates when an alert is triggered and follows systematic steps to address the issue.
  6. Completion Verification:
    • Indicated by a checkmark icon.
    • Confirms the successful completion of the response process.

This system operates cyclically, continuously monitoring to detect changes and activating an immediate response process when necessary. This approach maintains the organization’s efficiency and stability. It demonstrates the organization’s ability to respond quickly and systematically to changing environments.

The diagram emphasizes the interconnectedness of continuous operation, change management, monitoring, and the execution of structured processes, all working together to ensure effective adaptation to changes.

What to do first

From Claude with some prompting
This image outlines a progressive approach to data monitoring and alert systems, starting with simple metrics and evolving to more complex AI-driven solutions. The key steps are:

  1. “Keeping a Temperature”: Basic monitoring of system temperatures.
  2. “Monitoring”: Continuous observation of temperature data.
  3. “Alerts with thresholds”: Simple threshold-based alerts.
  4. More complex metrics: Including 10-minute thresholds, change counts, averages, and derivations.
  5. “More Indicators”: Expanding to additional KPIs and metrics.
  6. “Machine Learning ARIMA/LSTM”: Implementing advanced predictive models.
  7. “Alerts with predictions”: AI-driven predictive alerts.

The central message “EASY FIRST BEFORE THE AI !!” emphasizes starting with simpler methods before advancing to AI solutions.

Importantly, the image also implies that these simpler metrics and indicators established early on will later serve as valuable training data for AI models. This is shown by the arrows connecting all stages to the machine learning component, suggesting that the data collected throughout the process contributes to the AI’s learning and predictive capabilities.

This approach not only allows for a gradual build-up of system complexity but also ensures that when AI is implemented, it has a rich dataset to learn from, enhancing its effectiveness and accuracy.

TSDB flow for alerts

From Claude with some prompting
This image illustrates the flow and process of a Time Series Database (TSDB) system. The main components are:

Time Series Data: This is the input data stream containing time-stamped values from various sources or metrics.

Counting: It performs change detection on the incoming time series data to capture relevant events or anomalies.

Delta Value: The difference or change observed in the current value compared to a previous reference point, denoted as NOW() – previous value.

Time-series summary Value: Various summary statistics like MAX, MIN, and other aggregations are computed over the time window.

Threshold Checking: The delta values and other aggregations are evaluated against predefined thresholds for anomaly detection.

Alert: If any threshold conditions are violated, an alert is triggered to notify the monitoring system or personnel.

The process also considers correlations with other metrics for improved anomaly detection context. Additionally, AI-based techniques can derive new metrics from the existing data for enhanced monitoring capabilities.

In summary, this flow diagram represents the core functionality of a time series database focused on capturing, analyzing, and alerting on anomalies or deviations from expected patterns in real-time data streams.

Network Monitoring with AI

from DALL-E with some prompting
The image portrays a network monitoring system enhanced by AI, specifically utilizing deep learning. It shows a flow from the network infrastructure to the identification of an event, characterized by computed data with time information and severity. The “One Event” is clearly defined to avoid ambiguity. The system identifies patterns such as the time gap between events, event count, and relationships among devices and events, which are crucial for a comprehensive network analysis. AI deep learning algorithms work to process additional data (add-on data) and ambient data to detect anomalies and support predictive maintenance within the network.