This diagram visualizes the core concept that all components must be organically connected and work together to successfully operate AI workloads.
Importance of Organic Interconnections
Continuity of Data Flow
The data pipeline from Big Data → AI Model → AI Workload must operate seamlessly
Bottlenecks at any stage directly impact overall system performance
Cooperative Computing Resource Operations
GPU/CPU computational power must be balanced with HBM memory bandwidth
SSD I/O performance must harmonize with memory-processor data transfer speeds
Performance degradation in one component limits the efficiency of the entire system
Integrated Software Control Management
Load balancing, integration, and synchronization coordinate optimal hardware resource utilization
Real-time optimization of workload distribution and resource allocation
Infrastructure-based Stability Assurance
Stable power supply ensures continuous operation of all computing resources
Cooling systems prevent performance degradation through thermal management of high-performance hardware
Facility control maintains consistency of the overall operating environment
Key Insight
In AI systems, the weakest link determines overall performance. For example, no matter how powerful the GPU, if memory bandwidth is insufficient or cooling is inadequate, the entire system cannot achieve its full potential. Therefore, balanced design and integrated management of all components is crucial for AI workload success.
The diagram emphasizes that AI infrastructure is not just about having powerful individual components, but about creating a holistically optimized ecosystem where every element supports and enhances the others.
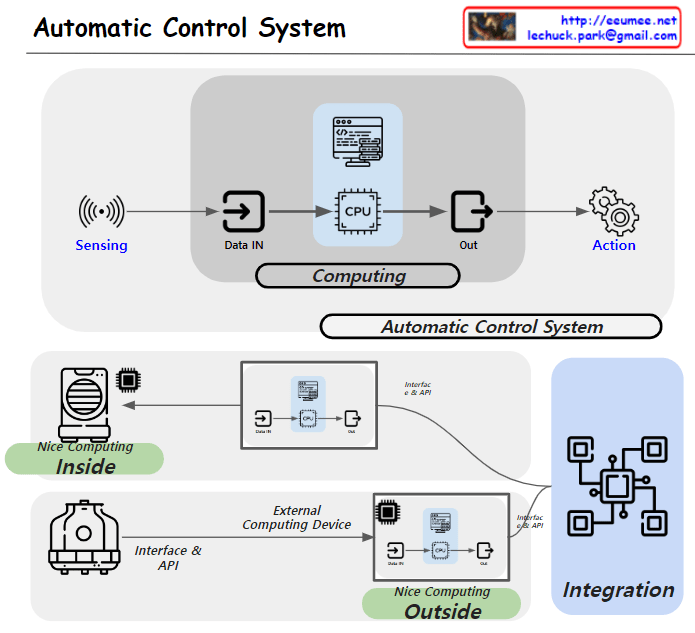
From Claude with some prompting focusing on the importance of computing in automatic control systems and the distinction between devices with sufficient computing power and those without:
Basic Structure of Automatic Control System:
The system operates in the sequence of Sensing -> Data IN -> CPU -> Out -> Action.
This entire process occurs within the ‘Computing’ phase, which is crucial for automatic control.
Device Classification Based on Computing Capability:
‘Nice Computing Inside’: Represents devices with sufficient computing power. These devices can process complex control logic independently.
‘Nice Computing Outside’: Indicates devices with limited computing capabilities. These devices rely on external computing resources for automatic control.
Utilization of External Computing Resources:
The ‘External Computing Device’ allows devices with limited computing power to perform advanced automatic control functions.
This is implemented through external computing devices such as PLCs (Programmable Logic Controllers) or DDCs (Direct Digital Controls).
System Integration:
‘Interface & API’ facilitates the connection and communication between various devices and external computing resources.
The ‘Integration’ section demonstrates how these diverse elements function as a unified automatic control system.
Importance of Computing:
In automatic control systems, computing plays a crucial role in data processing, decision-making, and generating control commands.
By appropriately utilizing internal or external computing resources, various types of equipment can function as part of an efficient automatic control system.
This diagram effectively illustrates the flexibility and scalability of automatic control systems, explaining different approaches based on computing capabilities. The forthcoming explanation about PLC/DDC and other external computing devices will likely provide more concrete insights into the practical implementation of these systems.
From Claude with some prompting This image conceptually illustrates various factors that can affect the performance of DC data collection. The main components include the facility generating the data, the facility network, PLC/DDC converters, an integration network, and the final collection/analysis system.
Factors that can impact data collection performance include the data generation rate, CPU performance, bandwidth limitations of the network medium, network topology, protocols used (such as TCP/IP and SNMP), input/output processing performance, and program logic.
The diagram systematically outlines the overall flow of the DC data collection process and the performance considerations at each stage. It covers elements like the facility, network infrastructure, data conversion, integration, and final collection/analysis.
By mapping out these components and potential bottlenecks, the image can aid in the design and optimization of data collection systems. It provides a comprehensive overview of the elements that need to be accounted for to ensure efficient data gathering performance.
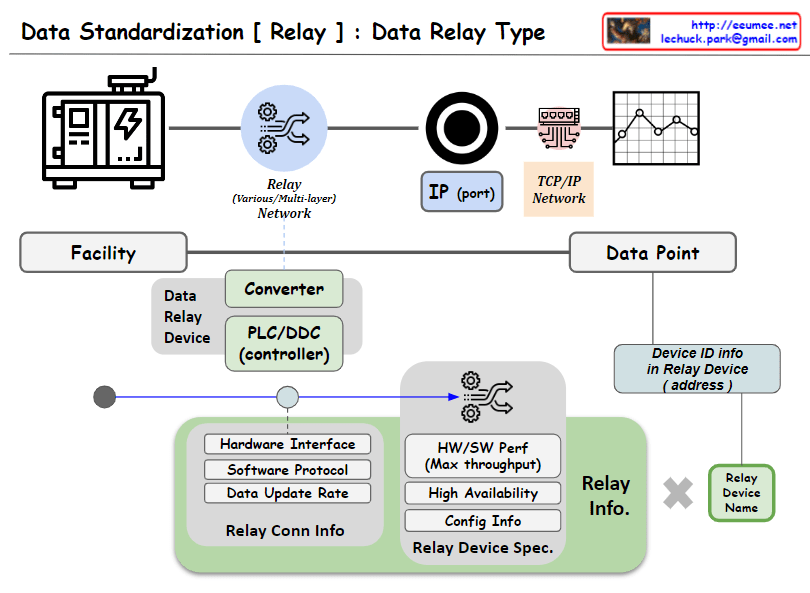
From ChatGPT with some prompting Certainly, the image represents the process of collecting data from facilities, demonstrating how different technical components interact.
Facility: This indicates the physical equipment or site generating data, likely composed of various sensors and devices.
Data Relay Device: It serves as an intermediary, relaying data collected from the facility to the network. It is depicted as being connected to the network via an IP address and port number.
TCP/IP Network: The path through which data is transmitted, utilizing the TCP/IP protocol to transfer data. This network manages the flow of data to the data point.
Data Point: The location where collected data is processed, where important metrics such as software protocol and data collection rate are set.
Network Topology: This represents the physical or logical layout of the network, including performance-related metrics such as the specifications of switches.
TCP/IP Layer: Although not explicitly illustrated in the image, the TCP/IP network is intended to be managed as a distinct logical layer. This emphasizes the advantages of managing and optimizing the data transmission process.
The image visually communicates these technical details, providing an overview of how each component is interconnected for the purpose of data collection and transmission.
From ChatGPT with some prompting The image appears to illustrate the process and key elements involved in data collection from a facility, with a focus on the intermediary step of converting or relaying data through devices such as PLCs (Programmable Logic Controllers) or DDCs (Direct Digital Controllers). These conversion devices play a pivotal role, and their functions are visualized as follows:
Data Conversion (Converter): This converts raw data from the facility into a format that is communicable across a network, ensuring compatibility with other devices through protocol or data format alignment.
Communication Gateway (PLC/DDC controller): The data relay device also serves as a gateway, managing the flow of data between the facility and the TCP/IP network, transmitting data in a form that is understandable to other devices on the network, and sometimes processing complex data.
Relay Information (Relay Info): As depicted, it defines the functional and technical details of the converter, including hardware interfaces, software protocols, data update rates, and relay connection information. This encompasses the device’s performance capabilities (maximum throughput), availability, configuration information, and relay device specifications.
Device Identification Information (Device ID info): Each relay device possesses unique identification information (address), which is a critical parameter for distinguishing and addressing devices within the network.
Relay Device Naming (Relay Device Name): Each device is assigned a discernible name for easy identification and reference within the system.
These components are crucial for standardized communication and processing of data, ensuring efficient collection and prompt handling of data. The diagram is designed to elucidate how these technical elements interact and fulfill their roles in the data relay process.
From Copilot with some prompting The image you shared represents a diagram titled “Facility Data Spec.” Here’s the description:
Image Description:
The diagram depicts the process of defining data requirements centered around facility-based data management.
On the left side, there’s an icon representing a “Facility,” which is connected to elements such as data generation rate, hardware interface, and software protocol.
A relay network (symbolized by gears) is linked to the facility and leads to an IP port.
The IP port connects to a TCP/IP network represented by circuit lines, ultimately leading to a data point.
The data point includes elements like data explanations and data units.
At the top right corner of the image, there are URLs and an email address.
Summary:
The diagram illustrates how data is generated within a facility, transmitted through various networks and protocols, and ultimately represented as data points.
This diagram provides valuable insights for managing facility-related data requirements. Understanding and effectively managing data specifications at the facility level is crucial for efficient data management.
From Gemini with some prompting Facility-centric data definition for facility data management Facility data management is the process of systematically collecting, storing, managing, and analyzing data generated from facilities. Facility data includes information on the facility’s condition, operation, and production. Facility data management can lead to the following benefits:
Improved facility efficiency Prediction and prevention of facility failures Increased productivity Energy savings Facility-centric data definition is a data definition approach that centers on facilities. It offers the following benefits:
Data consistency Improved data accessibility Increased data usability The diagram illustrates the following facility-centric data definition requirements for facility data management:
Facility: The facility is the entity that generates data. Different types of facilities exist, and each type generates different data. Data point: A data point is a unit of data generated from a facility. It includes the data name, data type, and data value. Network: The network is a communication network that connects facilities and data points. Data generated from facilities is transmitted to data points through the network. Data repository: The data repository is a place where data is stored. Different types of data repositories exist, and each type has different characteristics. Data processing: Data processing is the process of analyzing and utilizing data. It includes data cleaning, data analysis, and data visualization. Facility-centric data definition requirements for facility data management:
Data consistency: Facility-centric data definition should ensure data consistency. Data names, data types, and data values should be standardized to maintain data consistency. Data accessibility: Facility-centric data definition should improve data accessibility. The data repository should be appropriately selected, and data access permissions should be managed to enhance data accessibility. Data usability: Facility-centric data definition should increase data usability. Data analysis tools should be utilized, and data-driven decision-making should be implemented to improve data usability. Conclusion:
Facility-centric data definition requirements should be considered for facility data management. Facility-centric data definition can enhance data consistency, accessibility, and usability, leading to improved facility efficiency, productivity, and energy efficiency.
From DALL-E with some prompting The image represents the integration of AI into facility operation optimization. The process begins with AI suggesting guidelines based on predictive models that take into account variables like weather temperature and cooling load. These models undergo evaluation and analysis to assess risks and efficiency before being validated.
Guidance for optimization is then provided, focusing on reducing power usage in cooling towers, chillers, and pumps. A domain operator analyzes the risks and efficiency gains from the proposed changes.
The final stage involves a gradual application of the AI recommendations to the actual operation, with continuous updates to the AI model ensuring real-time adaptability. The percentage indicates the extent to which the AI’s guidance is applied, suggesting that while the guide may be 100% complete, the actual application may vary.
This is followed by the application and analysis (monitoring) phase, which ensures that the optimizations are working as intended and provides feedback for further improvements. This iterative process emphasizes the importance of continuously refining AI-driven operations to maintain optimal performance with minimal risk.