Data standardization : Collection info list

From ChatGPT with some prompting
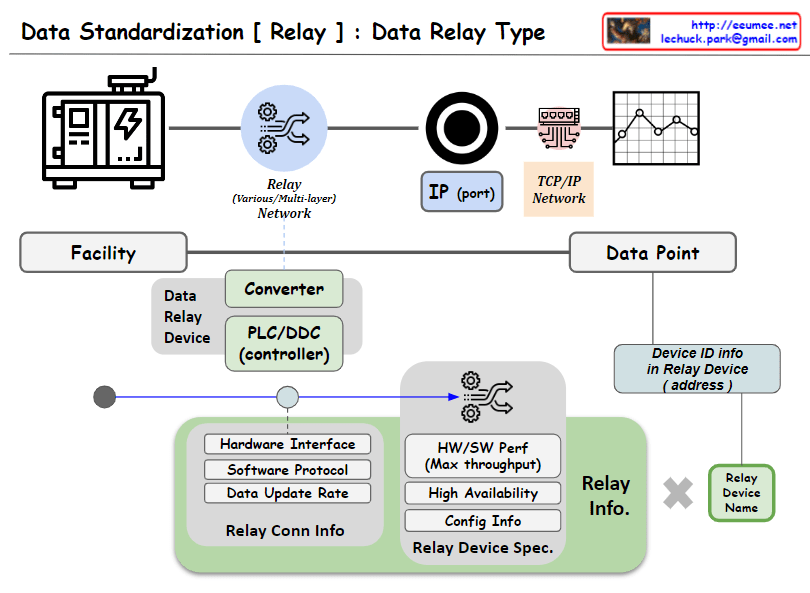
Certainly, the image represents the process of collecting data from facilities, demonstrating how different technical components interact.

  • Facility: This indicates the physical equipment or site generating data, likely composed of various sensors and devices.
  • Data Relay Device: It serves as an intermediary, relaying data collected from the facility to the network. It is depicted as being connected to the network via an IP address and port number.
  • TCP/IP Network: The path through which data is transmitted, utilizing the TCP/IP protocol to transfer data. This network manages the flow of data to the data point.
  • Data Point: The location where collected data is processed, where important metrics such as software protocol and data collection rate are set.
  • Network Topology: This represents the physical or logical layout of the network, including performance-related metrics such as the specifications of switches.
  • TCP/IP Layer: Although not explicitly illustrated in the image, the TCP/IP network is intended to be managed as a distinct logical layer. This emphasizes the advantages of managing and optimizing the data transmission process.

The image visually communicates these technical details, providing an overview of how each component is interconnected for the purpose of data collection and transmission.

Data Relay Type

From ChatGPT with some prompting
The image appears to illustrate the process and key elements involved in data collection from a facility, with a focus on the intermediary step of converting or relaying data through devices such as PLCs (Programmable Logic Controllers) or DDCs (Direct Digital Controllers). These conversion devices play a pivotal role, and their functions are visualized as follows:

Data Conversion (Converter): This converts raw data from the facility into a format that is communicable across a network, ensuring compatibility with other devices through protocol or data format alignment.

Communication Gateway (PLC/DDC controller): The data relay device also serves as a gateway, managing the flow of data between the facility and the TCP/IP network, transmitting data in a form that is understandable to other devices on the network, and sometimes processing complex data.

Relay Information (Relay Info): As depicted, it defines the functional and technical details of the converter, including hardware interfaces, software protocols, data update rates, and relay connection information. This encompasses the device’s performance capabilities (maximum throughput), availability, configuration information, and relay device specifications.

Device Identification Information (Device ID info): Each relay device possesses unique identification information (address), which is a critical parameter for distinguishing and addressing devices within the network.

Relay Device Naming (Relay Device Name): Each device is assigned a discernible name for easy identification and reference within the system.

These components are crucial for standardized communication and processing of data, ensuring efficient collection and prompt handling of data. The diagram is designed to elucidate how these technical elements interact and fulfill their roles in the data relay process.

through the LLM

From DALL-E with some prompting
The diagram provides a visual summary of how data from industrial facilities is aggregated and transformed through various processes, including equipment operation and business requirements. This data flow is depicted starting from the left, moving through icons representing servers, databases, safety equipment, and surveillance, indicating the collection and integration of diverse data types. The central AI chip symbolizes the analytical engine that processes this vast array of information, optimizing it for business intelligence and operational efficiency.

The processed data then feeds into a Large Language Model (LLM), highlighted in the diagram as the interface for communication. The AI’s capacity to analyze and manage this data results in a conversational output that closely resembles human interaction, as suggested by the “Like Human” label on the diagram. The integration of complex technical data with nuanced language processing allows the AI to communicate effectively with humans, symbolized by the network graphic on the right, which represents human connections.

In essence, the image encapsulates the journey of raw data from mechanical and logistical origins to sophisticated human-like dialogue, emphasizing the role of AI in bridging the gap between the technical and the personal in contemporary business environments.

DT for new biz

From DALL-E with some prompting
The image is a diagram that illustrates the process of digital transformation for discovering new business opportunities through the digitization of data center operations. The stages included are as follows:

  1. Digitization: The initial step of converting data into digital form.
  2. Digitalization: The process of enhancing operational know-how and creating new value through the experience and analysis with AI, as indicated by the phrases “Exp & Analysis with AI” and “Selling EXP and more!!”.
  3. Digital Transformation: The stage where insights and ideas gained from digitalization are actualized into new business changes.

At the bottom of the diagram, the phrase “All New for DC By Digital(data)” is accompanied by four boxes labeled Design, Deployment, Operating, and Customer. This indicates that all components of business operations are undergoing new changes based on digital data. The “NEW” marker emphasizes the new business opportunities that arise through digital transformation.

The diagram visually explains how transforming existing data into a digital format and using technologies like AI for analysis can improve operational knowledge and, as a result, generate and implement new business ideas. It specifically highlights that digital transformation in data center operations can provide opportunities for uncovering new business ventures.

Data Center Service Types

From the Bard with some prompting

Data Center Types Diagram

This diagram shows four main types of data centers:

  • Full-stack data centers provide a comprehensive solution for all of a customer’s IT infrastructure. This includes servers, networks, storage, security, and operational services.
  • In-house data centers are owned and managed by the customer. This includes servers, networks, storage, security, and operational services.
  • Server data centers provide only servers. This includes servers, networks, and operational services.
  • Multi-tenant colocation data centers are shared by multiple customers. This includes servers, networks, and operational services.

This diagram shows the various factors that should be considered when selecting a data center. It is important to choose the type that is best suited to the customer’s needs and budget.

AI DC Operation

from DALL-E with some prompting
The image represents a diagram that outlines the transformation of data center operations through the integration of Artificial Intelligence (AI). The flow from left to right demonstrates the transition from traditional data center operations to a new paradigm facilitated by AI. The diagram begins with legacy operations characterized by machines, alarm systems, and the processes managed by experts.

The section titled ‘DC Growing’ highlights the expansion of data centers and the new challenges that arise, including hyperscale, increased complexity, and shifts in customer demographics from retail to major Cloud Service Providers (CSP).

In the subsequent ‘DT’ and ‘AI’ sections, the diagram showcases how Digital Transformation (DT) and AI are integrated into data center operations, enhancing service reliability, automation, energy optimization, and customer service. The ‘AI Accelerator’ section illustrates the role of AI in speeding up the operations of a data center, setting new benchmarks for AI-driven operations.

This diagram visually summarizes how data centers evolve with technological advancements and how AI and digital transformation technologies are revolutionizing traditional operational practices.

Cooling Optimization

From DALL-E with some prompting
The illustration depicts a process where key operational metrics related to energy usage in cooling systems are analyzed by AI to achieve energy optimization. The AI model evaluates essential data such as running numbers, water usage, and operational temperature to continuously optimize the system while emphasizing stable operation without disruptions. This represents an advanced approach to managing cooling systems that enhances energy efficiency while minimizing operational risks.