Small Errors in AI

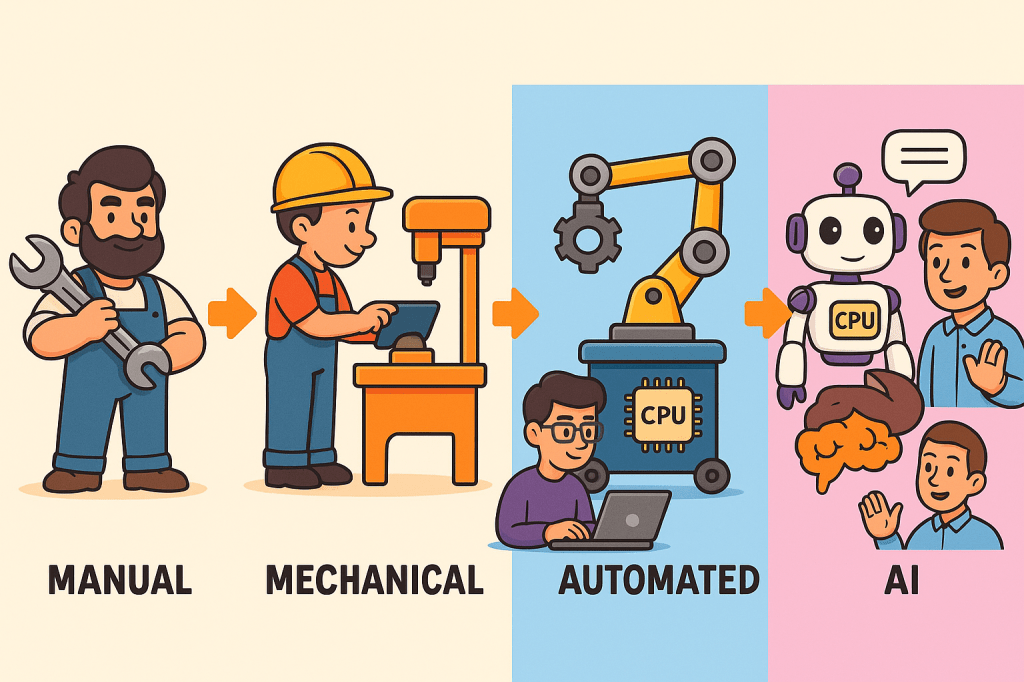
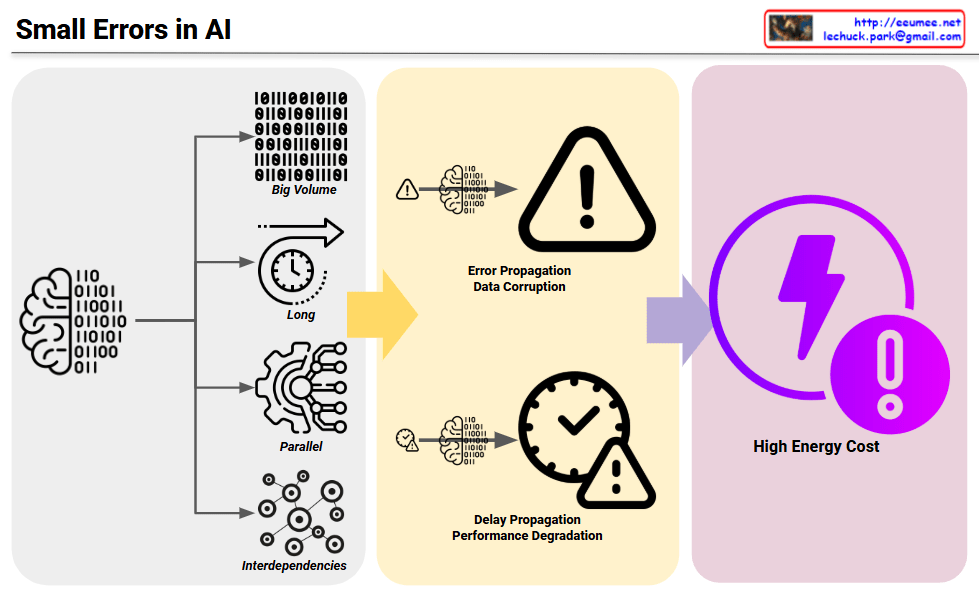
Four Core Characteristics of AI Tasks (Left)

AI systems have distinctive characteristics that make them particularly vulnerable to error amplification:

  • Big Volume: Processing massive amounts of data
  • Long Duration: Extended computational operations over time
  • Parallel Processing: Simultaneous execution of multiple tasks
  • Interdependencies: Complex interconnections where components influence each other

Small Error Amplification (Middle)

Due to these AI characteristics, small initial errors become amplified in two critical ways:

  • Error Propagation & Data Corruption: Minor errors spread throughout the system, significantly impacting overall data quality
  • Delay Propagation & Performance Degradation: Small delays accumulate and cascade, severely affecting entire system performance

Final Impact (Right)

  • Very High Energy Cost: Errors and performance degradation result in exponentially higher energy consumption than anticipated

Key Message

The four inherent characteristics of AI (big volume, long duration, parallel processing, and interdependencies) create a perfect storm where small errors can amplify exponentially, ultimately leading to enormously high energy costs. This diagram serves as a warning about the critical importance of preventing small errors in AI systems before they cascade into major problems.

With Claude

Human & Data with AI

Data Accumulation Perspective

History → Internet: All knowledge and information accumulated throughout human history is digitized through the internet and converted into AI training data. This consists of multimodal data including text, images, audio, and other formats.

Foundation Model: Large language models (LLMs) and multimodal models are pre-trained based on this vast accumulated data. Examples include GPT, BERT, CLIP, and similar architectures.

Human to AI: Applying Human Cognitive Patterns to AI

1. Chain of Thoughts

  • Implementation of human logical reasoning processes in the Reasoning stage
  • Mimicking human cognitive patterns that break down complex problems into step-by-step solutions
  • Replicating the human approach of “think → analyze → conclude” in AI systems

2. Mixture of Experts

  • AI implementation of human expert collaboration systems utilized in the Experts domain
  • Architecting the way human specialists collaborate on complex problems into model structures
  • Applying the human method of synthesizing multiple expert opinions for problem-solving into AI

3. Retrieval-Augmented Generation (RAG)

  • Implementing the human process of searching existing knowledge → generating new responses into AI systems
  • Systematizing the human approach of “reference material search → comprehensive judgment”

Personal/Enterprise/Sovereign Data Utilization

1. Personal Level

  • Utilizing individual documents, history, preferences, and private data in RAG systems
  • Providing personalized AI assistants and customized services

2. Enterprise Level

  • Integrating organizational internal documents, processes, and business data into RAG systems
  • Implementing enterprise-specific AI solutions and workflow automation

3. Sovereign Level

  • Connecting national or regional strategic data to RAG systems
  • Optimizing national security, policy decisions, and public services

Overall Significance: This architecture represents a Human-Centric AI system that transplants human cognitive abilities and thinking patterns into AI while utilizing multi-layered data from personal to national levels to evolve general-purpose AI (Foundation Models) into intelligent systems specialized for each level. It goes beyond simple data processing to implement human thinking methodologies themselves into next-generation AI systems.

With Claude

Dynamic Voltage and Frequency Scaling (in GPU)

This image illustrates the DVFS (Dynamic Voltage and Frequency Scaling) system workflow, which is a power management technique that dynamically adjusts CPU/GPU voltage and frequency to optimize power consumption.

Key Components and Operation Flow

1. Main Process Flow (Top Row)

  • Workload InitWorkload AnalysisDVFS Policy DecisionClock Frequency AdjustmentVoltage AdjustmentWorkload ExecutionWorkload Finish

2. Core System Components

Power State Management:

  • Basic power states: P0~P12 (P0 = highest performance, P12 = lowest power)
  • Real-time monitoring through PMU (Power Management Unit)

Analysis & Decision Phase:

  • Applies dynamic power consumption formula using algorithms
  • Considers thermal limits in analysis
  • Selects new power state (High: P0-P2, Low: P8-P10)
  • P-State changes occur within 10μs~1ms

Frequency Adjustment (PLL – Phase-Locked Loop):

  • Adjusts GPU core and memory clock frequencies
  • Typical range: 1,410MHz~1,200MHz (memory), 1,000MHz~600MHz (core)
  • Adjustment time: 10-100 microseconds

Voltage Adjustment (VRM – Voltage Regulator Module):

  • Adjusts voltage supplied to GPU core and memory
  • Typical range: 1.1V (P0) to 0.8V (P8)
  • VRM stabilizes voltage within tens of microseconds

3. Real-time Feedback Loop

The system operates a continuous feedback loop that readjusts P-states in real-time based on workload changes, maintaining optimal balance between performance and power efficiency.

4. Execution Phase

The GPU executes workloads at new frequency and voltage settings, with asynchronous adjustments based on frequency and voltage changes. After completion, the system transitions to low-power states (e.g., P10, P12) to conserve energy.


Summary: Key Benefits of DVFS

DVFS technology is for AI data centers as it optimizes GPU efficiency management to achieve maximum overall power efficiency. By intelligently scaling thousands of GPUs based on AI workload demands, DVFS can reduce total data center power consumption by 30-50% while maintaining peak AI performance during training and inference operations, making it essential for sustainable and cost-effective AI infrastructure at scale.

With Claude

Evolutions and THE NEXT?

This illustration depicts the evolution of human-machine interaction in four stages:

  1. Manual Tools – A human uses basic tools, representing traditional manual labor.
  2. Machine Operation – A worker operates a mechanical machine, indicating the industrial age.
  3. Programmed Automation – A robotic system with a CPU chip functions automatically based on human-developed programs.
  4. AI Collaboration – An AI-powered robot with a GPU chip works interactively with a human, showcasing the era of intelligent collaboration.

This is from “https://eeumee.net/2025/05/28/machine-changes/

New Expert with AI

Diagram Overview

This diagram illustrates the structural transformation of the professional services market in the AI era.

Current Situation (Left Side)

Users pay for three levels of professional services:

  • A+ Expert: Top-tier expertise and specialized knowledge
  • Expert: Mid-level professional services
  • Agent: Basic professional task handling

AI Era Transformation (Right Side)

Market Polarization:

  • A+ Expert Retained: “keep” – Highest-level human expertise remains essential
  • Mid-tier Replacement: “Replace” – Expert and Agent roles substituted by AI systems
  • Cost Concentration: Payment structure shifts from 3 categories → 2 categories

Key Implications

  1. Economic Efficiency: Reduced costs for mid-tier professional services
  2. Market Polarization: Premium human experts vs. AI systems structure
  3. Enhanced Accessibility: Democratization of professional services through AI
  4. Structural Transformation: Fundamental reshaping of professional service industries

Economic Impact

  • Winners: A+ Experts (strengthened monopolistic position), AI service providers, general consumers
  • Disrupted: Mid-tier professionals (Expert and Agent levels)
  • Market Change: Structural reorganization and pricing transformation in professional services

Conclusion

This diagram effectively demonstrates not just job displacement, but the economic restructuring of professional service markets, showing how AI-driven substitution leads to cost structure changes and market bipolarization.

With Claude

Machine Changes

This image titled “Machine Changes” visually illustrates the evolution of technology and machinery across different eras.

The diagram progresses from left to right with arrows showing the developmental stages:

Stage 1 (Left): Manual Labor Era

  • Tool icons (wrench, spanner)
  • Hand icon
  • Worker icon Representing basic manual work using simple tools.

Stage 2: Mechanization Era

  • Manufacturing equipment and machinery
  • Power-driven machines Depicting the industrial revolution period with mechanized production.

Stage 3 (Blue section): Automation and Computer Era

  • Power supply systems
  • CPU/processor chips
  • Computer systems
  • Programming code Representing automation through electronics and computer technology.

Stage 4 (Purple section): AI and Smart Technology Era

  • Robots
  • GPU processors
  • Artificial brain/AI
  • Interactive interfaces Representing modern smart technology integrated with artificial intelligence and robotics.

Additional Insight: The transition from the CPU era to the GPU era marks a fundamental shift in what drives technological capability. In the CPU era, program logic was the critical factor – the sophistication of algorithms and code determined system performance. However, in the GPU era, training data has become paramount – the quality, quantity, and diversity of data used to train AI models now determines the intelligence and effectiveness of these systems. This represents a shift from logic-driven computation to data-driven learning.

Overall, this infographic captures humanity’s technological evolution: Manual Labor → Mechanization → Automation → AI/Robotics, highlighting how the foundation of technological advancement has evolved from human skill to mechanical power to programmed logic to data-driven intelligence.

With Claude