NEW Power

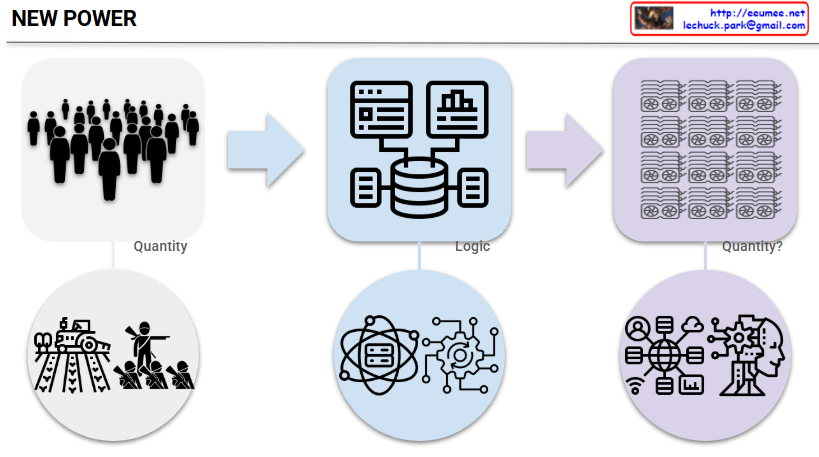
This image titled “NEW POWER” illustrates the paradigm shift in power structures in modern society.

Left Side (Past Power Structure):

  • Top: Silhouettes of people representing traditional hierarchical organizational structures
  • Bottom: Factories, smokestacks, and workers symbolizing the industrial age
  • Characteristic: “Quantity” (volume/scale) centered power

Center (Transition Process):

  • Top: Icons representing databases and digital interfaces
  • Bottom: Technical elements symbolizing networks and connectivity
  • Characteristic: “Logic” based systems

Right Side (New Power Structure):

  • Top: Grid-like array representing massive GPU clusters – the core computing resources of the AI era
  • Bottom: Icons symbolizing AI, cloud computing, data analytics, and other modern technologies
  • Characteristic: “Quantity?” (The return of quantitative competition?) – A new dimension of quantitative competition in the GPU era

This diagram illustrates a fascinating return in power structures. While efficiency, innovation, and network effects – these ‘logical’ elements – were important during the digital transition period, the ‘quantitative competition’ has returned as the core with the full advent of the AI era.

In other words, rather than smart algorithms or creative ideas, how many GPUs one can secure and operate has once again become the decisive competitive advantage. Just as the number of factories and machines determined national power during the Industrial Revolution, the message suggests that we’ve entered a new era of ‘quantitative warfare’ where GPU capacity determines dominance in the AI age.

With Claude

The Evolution of “Difference”

This image is a conceptual diagram showing how the domain of “Difference” is continuously expanded.

Two Drivers of Difference Expansion

Top Flow: Natural Emergence of Difference

  • Existence → Multiplicity → Influence → Change
  • The process by which new differences are continuously generated naturally in the universe and natural world.

Bottom Flow: Human Tools for Recognizing Difference

  • Letters & Digits → Computation & Memory → Computing Machine → Artificial Intelligence (LLM)
  • The evolution of tools that humans have developed to interpret, analyze, and process differences.

Center: Continuous Expansion Process of Difference Domain

The interaction between these two drivers creates a process that continuously expands the domain of difference, shown in the center:

Emergence of Difference

  • The stage where naturally occurring new differences become concretely manifest
  • Previously non-existent differences are continuously generated

↓ (Continuous Expansion)

Recognition of Difference

  • The stage where emerged differences are accepted as meaningful through human interpretation and analytical tools
  • Newly recognized differences are incorporated into the realm of distinguishable domains

Final Result: Expansion of Differentiation & Distinction

Differentiation & Distinction

  • Microscopically: More sophisticated digital and numerical distinctions
  • Macroscopically: Creation of new conceptual and social domains of distinction

Core Message

The natural emergence of difference and the development of human recognition tools create mutual feedback that continuously expands the domain of difference.

As the handwritten note on the left indicates (“AI expands the boundary of perceivable difference”), particularly in the AI era, the speed and scope of this expansion has dramatically increased. This represents a cyclical expansion process where new differences emerging from nature are recognized through increasingly sophisticated tools, and these recognized differences in turn enable new natural changes.

With Claude

ALL to LLM

This image is an architecture diagram titled “ALL to LLM” that illustrates the digital transformation of industrial facilities and AI-based operational management systems.

Left Section (Industrial Equipment):

  • Cooling tower (cooling system)
  • Chiller (refrigeration/cooling equipment)
  • Power transformer (electrical power conversion equipment)
  • UPS (Uninterruptible Power Supply)

Central Processing:

  • Monitor with gears: Equipment data collection and preprocessing system
  • Dashboard interface: “All to Bit” analog-to-digital conversion interface
  • Bottom gears and human icon: Manual/automated operational system management

Right Section (AI-based Operations):

  • Purple area with binary code (0s and 1s): All facility data converted to digital bit data
  • Robot icons: LLM-based automated operational systems
  • Document/analysis icons: AI analysis results and operational reports

Overall, this diagram represents the transformation from traditional manual or semi-automated industrial facility operations to a fully digitized system where all operational data is converted to bit-level information and managed through LLM-powered intelligent facility management and predictive maintenance in an integrated operational system.

With Claude

3 Computing in AI

AI Computing Architecture

3 Processing Types

1. Sequential Processing

  • Hardware: General CPU (Intel/ARM)
  • Function: Control flow, I/O, scheduling, Data preparation
  • Workload Share: Training 5%, Inference 5%

2. Parallel Stream Processing

  • Hardware: CUDA core (Stream process)
  • Function: FP32/FP16 Vector/Scalar, memory management
  • Workload Share: Training 10%, Inference 30%

3. Matrix Processing

  • Hardware: Tensor core (Matrix core)
  • Function: Mixed-precision (FP8/FP16) MMA, Sparse matrix operations
  • Workload Share: Training 85%+, Inference 65%+

Key Insight

The majority of AI workloads are concentrated in matrix processing because matrix multiplication is the core operation in deep learning. Tensor cores are the key component for AI performance improvement.

With Claude

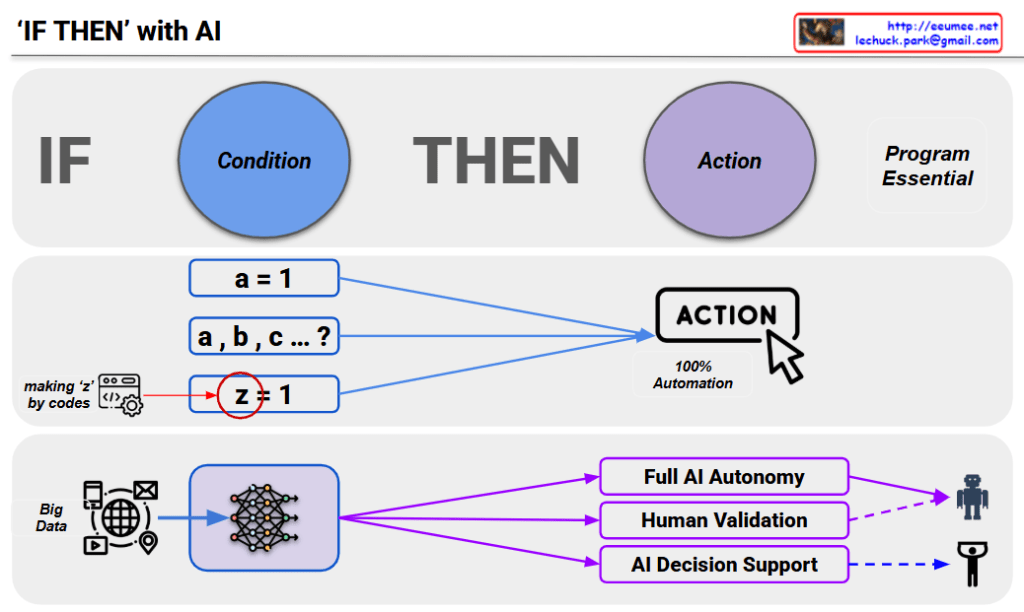
‘IF THEN’ with AI

This image is a diagram titled “IF-THEN with AI” that explains conditional logic and automation levels in AI systems.

Top Section: Basic IF-THEN Structure

  • IF (Condition): Conditional part shown in blue circle
  • THEN (Action): Execution part shown in purple circle
  • Marked as “Program Essential,” emphasizing it as a core programming element

Middle Section: Evolution of Conditional Complexity

AI is ultimately a program, and like humans who wanted to predict by sensing data, making judgments, and taking actions based on those criteria. IF-THEN is essentially prediction – the foundation of programming that involves recognizing situations, making judgments, and taking actions.

Evolution stages of data/formulas:

  • a = 1: Simple value
  • a, b, c … ?: Processing multiple complex values simultaneously
  • Z ≠ 1: A condition that finds the z value through code on the left and compares it to 1 (highlighted with red circle, with annotation “making ‘z’ by codes”)

Now we input massive amounts of data and analyze with AI, though it has somewhat probabilistic characteristics.

Bottom Section: Evolution of AI Decision-Making Levels

Starting from Big Data through AI networks, three development directions:

  1. Full AI Autonomy: Complete automation that evolved to “Fine, just let AI handle it”
  2. Human Validation: Stage where humans evaluate AI judgments and incorporate them into operations
  3. AI Decision Support: Approach where humans initially handle the THEN action

Key Perspective: While these three development directions exist, there’s a need for judgment regarding decisions based on the quality of data used in analysis/judgment. This diagram shows that it’s not just about automation levels, but that data quality-based reliability assessment is a crucial consideration.

Summary

This diagram illustrates the evolution from simple conditional programming to complex AI systems, emphasizing that AI fundamentally operates on IF-THEN logic for prediction and decision-making. The key insight is that regardless of automation level, the quality of input data remains critical for reliable AI decision-making processes.

With Claude

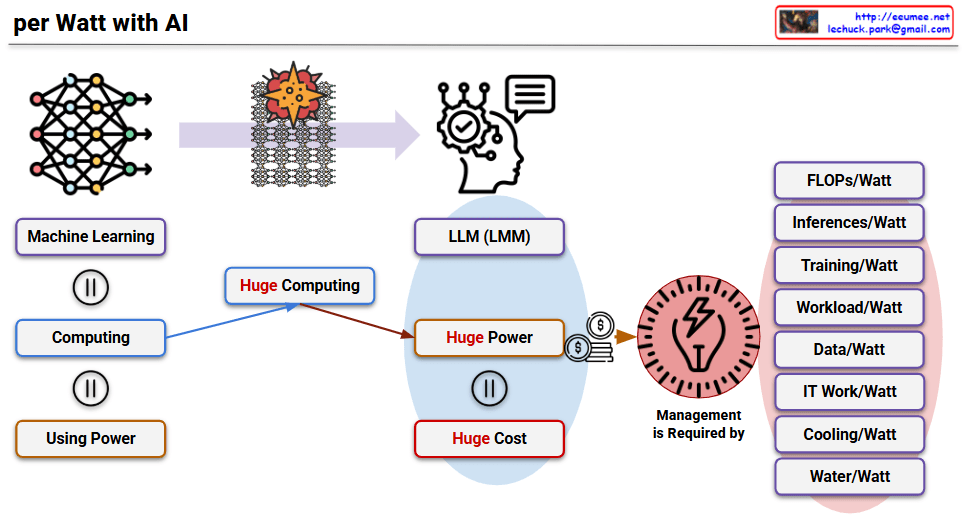
per Watt with AI

This image titled “per Watt with AI” is a diagram explaining the paradigm shift in power efficiency following the AI era, particularly after the emergence of LLMs.

Overall Context

Core Structure of AI Development:

  • Machine Learning = Computing = Using Power
  • The equal signs (=) indicate that these three elements are essentially the same concept. In other words, AI machine learning inherently means large-scale computing, which inevitably involves power consumption.

Characteristics of LLMs: As AI, particularly LLMs, have proven their effectiveness, tremendous progress has been made. However, due to their technical characteristics, they have the following structure:

  • Huge Computing: Massively parallel processing of simple tasks
  • Huge Power: Enormous power consumption due to this parallel processing
  • Huge Cost: Power costs and infrastructure expenses

Importance of Power Efficiency Metrics

With hardware advancements making this approach practically effective, power consumption has become a critical issue affecting even the global ecosystem. Therefore, power is now used as a performance indicator for all operations.

Key Power Efficiency Metrics

Performance-related:

  • FLOPs/Watt: Floating-point operations per watt
  • Inferences/Watt: Number of inferences processed per watt
  • Training/Watt: Training performance per watt

Operations-related:

  • Workload/Watt: Workload processing capacity per watt
  • Data/Watt: Data processing capacity per watt
  • IT Work/Watt: IT work processing capacity per watt

Infrastructure-related:

  • Cooling/Watt: Cooling efficiency per watt
  • Water/Watt: Water usage efficiency per watt

This diagram illustrates that in the AI era, power efficiency has become the core criterion for all performance evaluations, transcending simple technical metrics to encompass environmental, economic, and social perspectives.

With Claude