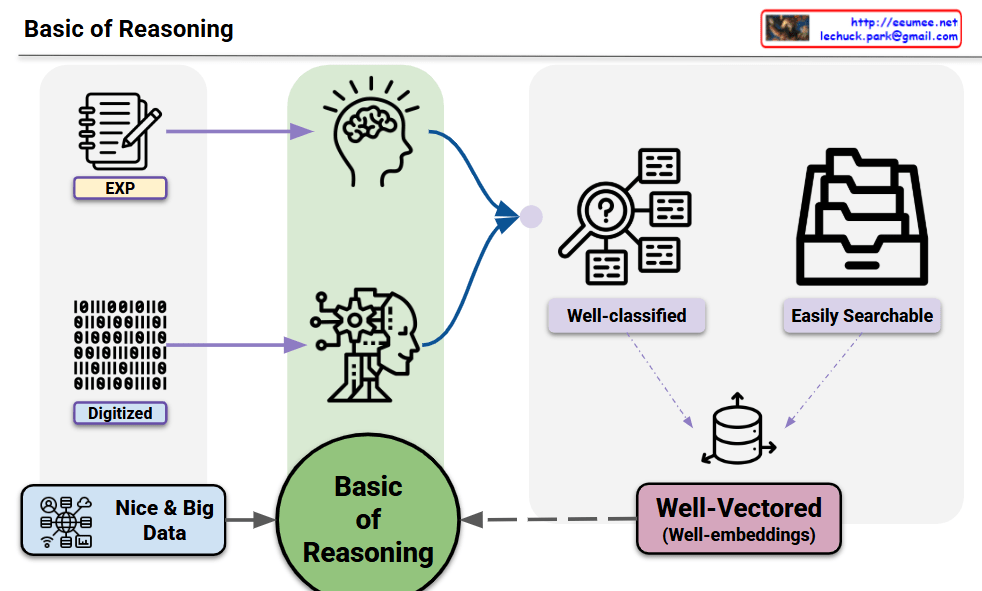
From RNN to Transformer

Visual Analysis: RNN vs Transformer

Visual Structure Comparison

RNN (Top): Sequential Chain

  • Linear flow: Circular nodes connected left-to-right
  • Hidden states: Each node processes sequentially
  • Attention weights: Numbers (2,5,11,4,2) show token importance
  • Bottleneck: Must process one token at a time

Transformer (Bottom): Parallel Grid

  • Matrix layout: 5×5 grid of interconnected nodes
  • Self-attention: All tokens connect to all others simultaneously
  • Multi-head: 5 parallel attention heads working together
  • Position encoding: Separate blue boxes handle sequence order

Key Visual Insights

Processing Pattern

  • RNN: Linear chain → Sequential dependency
  • Transformer: Interconnected grid → Parallel freedom

Information Flow

  • RNN: Single path with accumulating states
  • Transformer: Multiple simultaneous pathways

Attention Mechanism

  • RNN: Weights applied to existing sequence
  • Transformer: Direct connections between all elements

Design Effectiveness

The diagram succeeds by using:

  • Contrasting layouts to show architectural differences
  • Color coding to highlight attention mechanisms
  • Clear labels (“Sequential” vs “Parallel Processing”)
  • Visual metaphors that make complex concepts intuitive

The grid vs chain visualization immediately conveys why Transformers enable faster, more scalable processing than RNNs.

Summary

This diagram effectively illustrates the fundamental shift from sequential to parallel processing in neural architecture. The visual contrast between RNN’s linear chain and Transformer’s interconnected grid clearly demonstrates why Transformers revolutionized AI by enabling massive parallelization and better long-range dependencies.

With Claude

Together is not easy

This infographic titled “Together” emphasizes the critical importance of parallel processing = working together across all domains – computing, AI, and human society.

Core Concept:

The Common Thread Across All 5 Domains – ‘Parallel Processing’:

  1. Parallel Processing – Simultaneous task execution in computer systems
  2. Deep Learning – AI’s multi-layered neural networks learning in parallel
  3. Multi Processing – Collaborative work across multiple processors
  4. Co-work – Human collaboration and teamwork
  5. Social – Collective cooperation among community members

Essential Elements of Parallel Processing:

  • Sync (Synchronization) – Coordinating all components to work harmoniously
  • Share (Sharing) – Efficient distribution of resources and information
  • Optimize (Optimization) – Maximizing performance while minimizing energy consumption
  • Energy (Energy) – The inevitable cost required when working together

Reinterpreted Message: “togetherness is always difficult, but it’s something we have to do.”

This isn’t merely about the challenges of cooperation. Rather, it conveys that parallel processing (working together) in all systems requires high energy costs, but only through optimization via synchronization and sharing can we achieve true efficiency and performance.

Whether in computing systems, AI, or human society – all complex systems cannot advance without parallel cooperation among individual components. This is an unavoidable and essential process for any sophisticated system to function and evolve. The insight reveals a fundamental truth: the energy investment in “togetherness” is not just worthwhile, but absolutely necessary for progress.

With Claude

Human Extends

This image is a conceptual diagram titled “Human Extend” that illustrates the cognitive extension of human capabilities and the role of AI tools.

Core Concept

“Human See” at the center represents the core of human observation and understanding abilities.

Bidirectional Extension Structure

Left: Macro Perspective

  • Represented by an orange circle
  • “A deeper understanding of the micro leads to better macro predictions”

Right: Micro Perspective

  • Represented by a blue circle
  • “A deeper understanding of the macro leads to better micro predictions”

Role of AI and Data

The upper portion shows two supporting tools:

  1. AI (by Tool): Represented by an atomic structure-like icon
  2. Data (by Data): Represented by network and database icons

Overall Meaning

This diagram visually represents the concept that human cognitive abilities can be extended through AI tools and data analysis, enabling deeper mutual understanding between microscopic details and macroscopic patterns. It illustrates the complementary relationship where understanding small details leads to better prediction of the big picture, and understanding the big picture leads to more accurate prediction of details.

The diagram suggests that AI and data serve as amplifying tools that enhance human perception, allowing for more sophisticated analysis across different scales of observation and prediction.

with Claude

3 Key on the AI era

This diagram illustrates the 3 Core Technological Components of AI World and their surrounding challenges.

AI World’s 3 Core Technological Components

Central AI World Components:

  1. AI infra (AI Infrastructure) – The foundational technology that powers AI systems
  2. AI Model – Core algorithms and model technologies represented by neural networks
  3. AI Agent – Intelligent systems that perform actual tasks and operations

Surrounding 3 Key Challenges

1. Data – Left Area

Data management as the raw material for AI technology:

  • Data: Raw data collection
  • Verified: Validated and quality-controlled data
  • Easy to AI: Data preprocessed and optimized for AI processing

2. Optimization – Bottom Area

Performance enhancement of AI technology:

  • Optimization: System optimization
  • Fit to data: Data fitting and adaptation
  • Energy cost: Efficiency and resource management

3. Verification – Right Area

Ensuring reliability and trustworthiness of AI technology:

  • Verification: Technology validation process
  • Right?: Accuracy assessment
  • Humanism: Alignment with human-centered values

This diagram demonstrates how the three core technological elements – AI Infrastructure, AI Model, and AI Agent – form the center of AI World, while interacting with the three fundamental challenges of Data, Optimization, and Verification to create a comprehensive AI ecosystem.

With Claude

network issue in a GPU workload

This diagram illustrates network bottleneck issues in large-scale AI/ML systems.

Key Components:

Left side:

  • Big Data and AI Model/Workload connected to the system via network

Center:

  • Large-scale GPU cluster (multiple GPUs arranged in a grid pattern)
  • Each GPU is interconnected for distributed processing

Right side:

  • Power supply and cooling systems

Core Problem:

The network interface specifications shown at the bottom reveal bandwidth mismatches:

  • inter GPU NVLink: 600GB/s
  • inter Server Infiniband: 400Gbps
  • CPU/RAM/DISK PCIe/NVLink: (relatively lower bandwidth)

“One Issue” – System-wide Propagation:

A network bottleneck or failure at a specific point (marked with red circle) “spreads throughout the entire system” as indicated by the yellow arrows.

This diagram warns that in large-scale AI training, a single network bottleneck can have catastrophic effects on overall system performance. It visualizes how bandwidth imbalances at various levels – GPU-to-GPU communication, server-to-server communication, and storage access – can compromise the efficiency of the entire system. The cascading effect demonstrates how network issues can quickly propagate and impact the performance of distributed AI workloads across the infrastructure.

with Claude

NEW Power

This image titled “NEW POWER” illustrates the paradigm shift in power structures in modern society.

Left Side (Past Power Structure):

  • Top: Silhouettes of people representing traditional hierarchical organizational structures
  • Bottom: Factories, smokestacks, and workers symbolizing the industrial age
  • Characteristic: “Quantity” (volume/scale) centered power

Center (Transition Process):

  • Top: Icons representing databases and digital interfaces
  • Bottom: Technical elements symbolizing networks and connectivity
  • Characteristic: “Logic” based systems

Right Side (New Power Structure):

  • Top: Grid-like array representing massive GPU clusters – the core computing resources of the AI era
  • Bottom: Icons symbolizing AI, cloud computing, data analytics, and other modern technologies
  • Characteristic: “Quantity?” (The return of quantitative competition?) – A new dimension of quantitative competition in the GPU era

This diagram illustrates a fascinating return in power structures. While efficiency, innovation, and network effects – these ‘logical’ elements – were important during the digital transition period, the ‘quantitative competition’ has returned as the core with the full advent of the AI era.

In other words, rather than smart algorithms or creative ideas, how many GPUs one can secure and operate has once again become the decisive competitive advantage. Just as the number of factories and machines determined national power during the Industrial Revolution, the message suggests that we’ve entered a new era of ‘quantitative warfare’ where GPU capacity determines dominance in the AI age.

With Claude