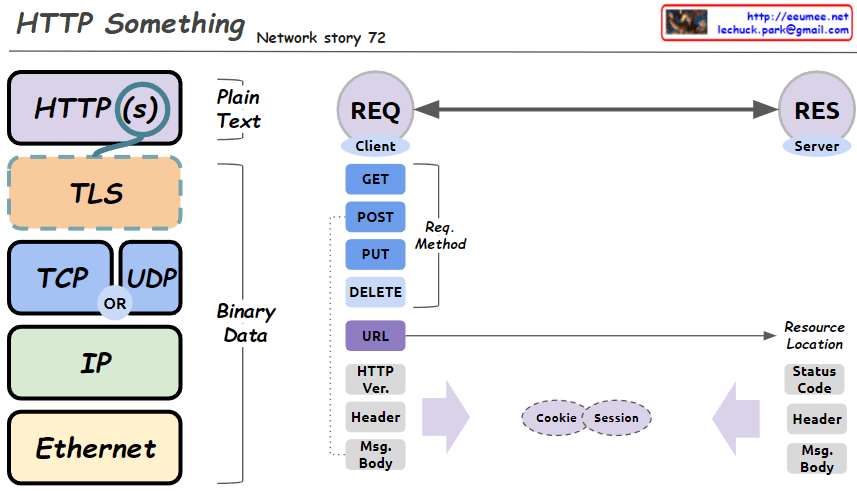
From Claude with some prompting This image is a diagram explaining the structure of HTTP (Hypertext Transfer Protocol) and related network protocols. The main components are:
Protocol Stack:
HTTP(S)
TLS (Transport Layer Security)
TCP (Transmission Control Protocol) or UDP (User Datagram Protocol)
IP (Internet Protocol)
Ethernet
Data Types:
Plain Text: At HTTP(S) and TLS levels
Binary Data: From TCP/UDP down to Ethernet
Communication between Client (REQ) and Server (RES):
Request Methods: GET, POST, PUT, DELETE
URL (Resource Location)
HTTP Version
Headers
Message Body
Cookies and Sessions: Mechanisms for exchanging information between client and server
Server Response:
Status Code
Headers
Message Body
This diagram provides a simplified view of the basic structure of HTTP requests and responses, as well as the underlying network protocol layers that support them. It visually explains the fundamental principles of web communication.
From Claude with some prompting This image illustrates the concept of “Optimization” through four graphs representing different optimization levels:
Optimization Level 1: Shows basic usage and supply curves.
Optimization Level 2: Similar to Level 1, but with supply (green arrows) managed more efficiently.
Optimization Level 3: Demonstrates both usage and supply being managed more efficiently. Green arrows (supply) are adjusted at multiple points.
Optimization Level 4: Usage and supply curves almost align, indicating optimal efficiency achieved.
In each graph, the orange line represents usage, while green arrows indicate supply. As the optimization level increases, the two lines become more aligned, showing improved efficiency.
The image title “Optimization” is at the top. The legend in the bottom left correctly shows that green arrows represent supply and orange arrows represent usage.
From Claude with some prompting This image provides an enhanced explanation of Einstein’s famous mass-energy equivalence equation E=mc². The key additions and contents are as follows:
Units for each component have been added:
Energy (E): J (Joules), erg
Mass (m): Kg (kilograms), g (grams)
Celeritas (c): m/s (meters per second), cm/s (centimeters per second)
Equations showing unit consistency have been included:
SI units: J = kg · (m/s)²
CGS units: erg = g · (cm/s)²
The original explanations are maintained:
Mass: constant value that does not change, law of conservation of mass
Celeritas: The speed of light, “Real existence, least relativity, all same for any observer”
Overall equation: For understanding the relative if Mass and light, human measurements
The etymology of Celeritas (from the Latin word meaning “speed” or “swiftness”) is retained.
These enhancements deepen the understanding of each component of the equation, particularly with the addition of units, which clarifies what units should be used in actual calculations. This provides crucial information for practical application and comprehension of the equation.
From Claude with some prompting This image illustrates the TCP (Transmission Control Protocol) packet structure and the Nagle algorithm.
Top section:
Shows data transfer between two computers.
Demonstrates how data (payload) is divided into multiple packets for transmission.
Middle section – Packet structure:
Data Payload: The actual data being transmitted
TCP/IP header: Contains control information for communication
Ethernet header: 14 Bytes
IPv4 header: 20 Bytes
TCP header: 20 Bytes
Data + Padding: Actual data and padding added if necessary
MTU Limit: Maximum Transmission Unit limit
Bottom section – Nagle’s Algorithm:
Normal TCP/IP transmission: Small data packets are sent individually
With Nagle’s Algorithm: Small data packets are combined into larger packets before transmission
Packet sending conditions:
When an ACK is received
On timeout
When the TCP sending window overflows
The image effectively demonstrates the packet structure in TCP communications and explains how the Nagle algorithm improves network efficiency. The main purpose of Nagle’s algorithm is to reduce network overhead by bundling small packets together before transmission.
From Claude with some prompting focusing on the importance of the digital twin-based floor operation optimization system for high-performance computing rooms in AI data centers, emphasizing stability and energy efficiency. I’ll highlight the key elements marked with exclamation points.
Purpose of the system:
Enhance stability
Improve energy efficiency
Optimize floor operations
Key elements (marked with exclamation points):
Interface:
Efficient data collection interface using IPMI, Redis and Nvidia DCGM
Real-time monitoring of high-performance servers and GPUs to ensure stability
Intelligent/Smart PDU:
Precise power usage measurement contributing to energy efficiency
Early detection of anomalies to improve stability
High Resolution under 1 sec:
High-resolution data collection in less than a second enables real-time response
Immediate detection of rapid changes or anomalies to enhance stability
Analysis with AI:
AI-based analysis of collected data to derive optimization strategies
Utilized for predictive maintenance and energy usage optimization
Computing Room Digital Twin:
Virtual replication of the actual computing room for simulation and optimization
Scenario testing for various situations to improve stability and efficiency
This system collects and analyzes data from high-power servers, power distribution units, cooling facilities, and environmental sensors. It optimizes the operation of AI data center computing rooms, enhances stability, and improves energy efficiency.
By leveraging digital twin technology, the system enables not only real-time monitoring but also predictive maintenance, energy usage optimization, and proactive response to potential issues. This leads to improved stability and reduced operational costs in high-performance computing environments.
Ultimately, this system serves as a critical infrastructure for efficient operation of AI data centers, energy conservation, and stable service provision. It addresses the unique challenges of managing high-density, high-performance computing environments, ensuring optimal performance while minimizing risks and energy consumption.