AI Oops!!

with a ChatGPT’s help
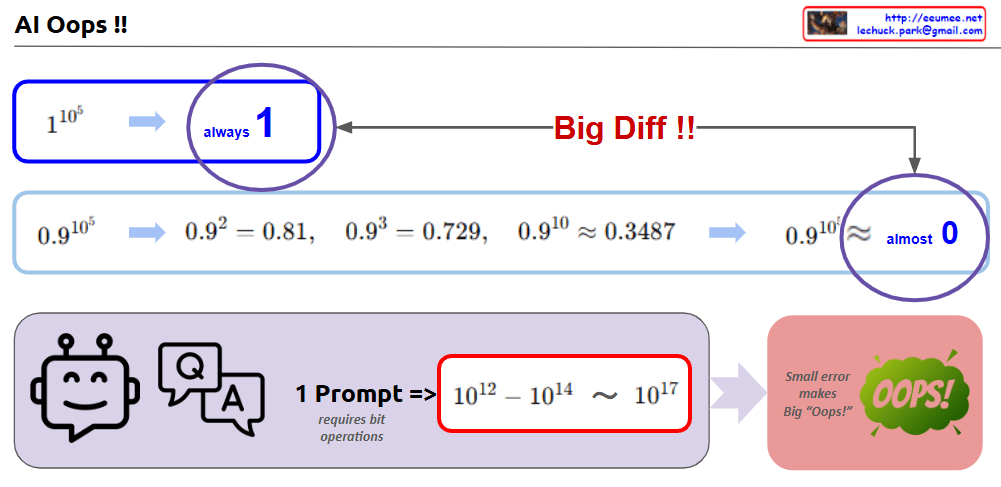
This image highlights how small errors in AI or computational operations can lead to significant differences or problems. Here’s a sentence-based explanation:


  1. Small changes lead to big differences
    • 1^10⁵: This consistently equals 1, no matter how many iterations are performed.
    • 0.9^10⁵: On the other hand, this gradually decreases and approaches 0, creating a significant difference.
      • For example:
        • 0.92=0.810.9^2 = 0.810.92=0.81,
        • 0.93=0.7290.9^3 = 0.7290.93=0.729,
        • 0.910≈0.34870.9^{10} ≈ 0.34870.910≈0.3487,
        • 0.9105≈almost00.9^{10^5} ≈ almost 00.9105≈almost0.
  2. The “Oops” in AI or calculations
    • A single incorrect computation or prompt can result in a massive amount of processing (from 10^12 to 10^17 bit operations).
    • This demonstrates how a small error can lead to a big “Oops!” in the overall system.

Summary:
The image visually explains the importance of precision and how minor computational inaccuracies can cascade into significant consequences, especially in AI or large-scale calculations.

Server room Connected Data

with a claude’s help
This diagram represents the key interconnected elements within a server room in a data center. It is composed of three main components:

  1. Server Load: This represents the computing processing demand on the server hardware.
  2. Cooling Load: This represents the cooling system’s load required to remove the heat generated by the server equipment.
  3. Power Load: This represents the electrical power demand needed to operate the server equipment.

These three elements are closely related. As the Server Load increases, the Power Load increases, which then leads to greater heat generation and an increase in Cooling Load.

Applying this to an actual data center environment, important considerations would include:

  1. Server rack placement: Efficient rack arrangement to optimize cooling performance and power distribution.
  2. Hot air exhaust channels: Dedicated pathways to effectively expel the hot air from the server racks, reducing Cooling Load.
  3. Cooling system capacity: Sufficient CRAC (Computer Room Air Conditioning) units to handle the Cooling Load.
  4. Power supply: Appropriate PDU (Power Distribution Unit) to provide the necessary Power Load for stable server operation.

By accounting for these real-world data center infrastructure elements, the diagram can be further enhanced to provide more practical and applicable insights.

Overall, this diagram effectively illustrates the core interdependent components within a server room and how they relate to the actual data center operational environment.Copy

Prophet

With a Claude’s help
The image appears to be a diagram or concept map that explains the components of the Prophet forecasting model, which is a popular time series forecasting library in Python. Here’s a breakdown of the key elements:

The diagram also shows different types of trend, seasonality, and holiday effects that the Prophet model can handle.

The main function is y(t), which represents the time series data that needs to be forecasted.

y(t) is composed of four additive components:

g(t): The trend component, which represents the long-term linear or piecewise linear growth trend in the data.

s(t): The seasonality component, which captures yearly and weekly seasonality patterns in the data.

h(t): The holiday effects component, which accounts for the impact of holidays or special events on the data.

e: The error term, which represents noise and uncertainty in the data.

PUE Details

With a Claude’s Help
This image provides detailed information on Power Usage Effectiveness (PUE), a key metric for measuring the energy efficiency of a data center.

The overall structure shows that power received from the High Power Receiver is distributed to various components, including IT equipment and cooling systems, through the Power Distributor.

To calculate PUE, several granular metrics are required, such as IT power, cooling power, and total power consumption. These detailed items are grouped into larger categories for easier management and standardization.

For example, IT power is further broken down into servers, storage, and network equipment. Cooling power includes CRAC units, cooling towers, and pump systems. The power supply stages are also differentiated to identify points of power loss.

Furthermore, detailed monitoring of individual IT and cooling equipment power consumption enables more accurate PUE calculation and optimization.

In summary, effective PUE management requires categorizing the total power usage into IT power, cooling power, and other power, and then further subdividing these groups into standardized, measurable components. Real-time monitoring and data analysis are crucial for continually improving energy efficiency in the data center.

The Era of True Artificial Intelligence: Bridging Human and Machine Learning  

AI has now reached a level that can truly be called Artificial Intelligence. This is especially evident in the era of Machine Learning (ML). Humans learn through experiences—essentially data—and make judgments and take actions based on them. These actions are not always perfect or correct, but through continuous learning and experience, they strive for better outcomes, which inherently reflects a probabilistic and statistical perspective.

Similarly, ML learns from massive datasets to identify rules and minimize errors. However, it cannot achieve 100% perfection because it cannot learn all possible data, which is essentially infinite. Despite this, recent advancements in infrastructure and access to vast amounts of data have enabled AI to reach accuracy levels of 90% to 99.99%, appearing almost perfect.

Nevertheless, there still remains the elusive 0.00…1% of uncertainty, stemming from the fundamental limitation of incomplete data learning. Ultimately, AI is not so different from humans in how it learns and makes probabilistic decisions. For this reason, we can truly call it Artificial Intelligence.