CXL ( Compute express link )

Traditional CPU-GPU vs CXL Key Comparison

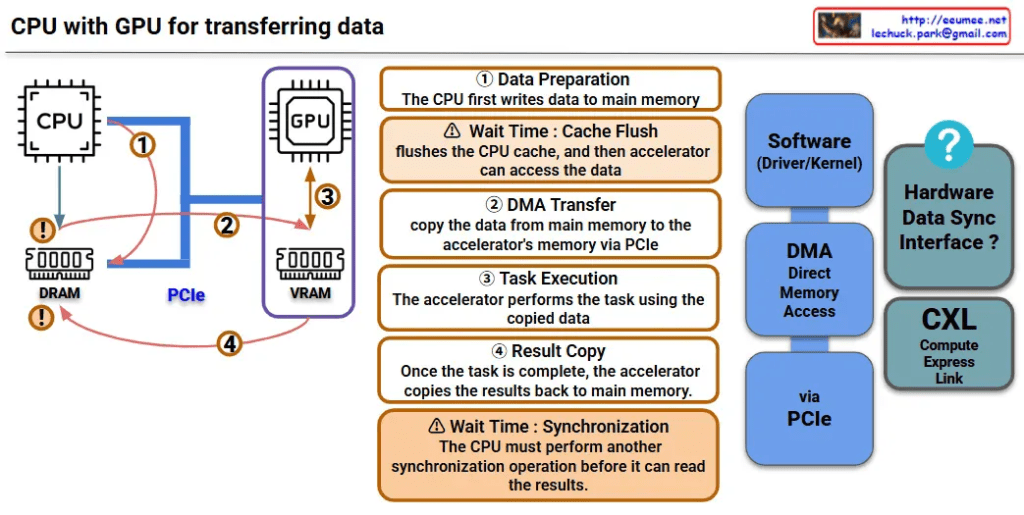
🔴 PCIe System Inefficiencies

Separated Memory Architecture

  • Isolated Memory: CPU(DDR4) ↔ GPU(VRAM) completely separated
  • Mandatory Data Copying: CPU Memory → PCIe → GPU Memory → Computation → Result Copy
  • PCIe Bandwidth Bottleneck: Limited to 64GB/s maximum

Major Overheads

  • Memory Copy Latency: Tens of ms to seconds for large data transfers
  • Synchronization Wait: CPU cache flush + GPU synchronization
  • Memory Duplication: Same data stored in both CPU and GPU memory

🟢 CXL Core Improvements

1. Unified Memory Architecture

Before: CPU [Memory] ←PCIe→ [Memory] GPU (Separated)
After: CPU ←CXL→ GPU → Shared Memory Pool (Unified)

2. Zero-Copy & Hardware Cache Coherency

  • Eliminates Memory Copying: Data access through pointer sharing only
  • Automatic Synchronization: CXL controller ensures cache coherency at HW level
  • Real-time Sharing: GPU can immediately access CPU-modified data

3. Performance Improvements

MetricPCIe 4.0CXL 2.0Improvement
Bandwidth64 GB/s128 GB/s2x
Latency1-2μs200-400ns5-10x
Memory CopyRequiredEliminatedComplete Removal

🚀 Practical Benefits

AI/ML: 90% reduction in training data loading time, larger model processing capability
HPC: Real-time large dataset exchange, memory constraint elimination
Cloud: Maximized server resource efficiency through memory pooling


💡 CXL Core Innovations

  1. Zero-Copy Sharing – Eliminates physical data movement
  2. HW-based Coherency – Complete removal of software synchronization overhead
  3. Memory Virtualization – Scalable memory pool beyond physical constraints
  4. Heterogeneous Optimization – Seamless integration of CPU, GPU, FPGA, etc.

The key technical improvements of CXL – Zero-Copy sharing and hardware-based cache coherency – are emphasized as the most revolutionary aspects that fundamentally solve the traditional PCIe bottlenecks.

With Claude

Operations : Changes Detection and then

Process Analysis from “Change Drives Operations” Perspective

Core Philosophy

“No Change, No Operation” – This diagram illustrates the fundamental IT operations principle that operations are driven by change detection.

Change-Centric Operations Framework

1. Change Detection as the Starting Point of All Operations

  • Top-tier monitoring systems continuously detect changes
  • No Changes = No Operations (left gray boxes)
  • Change Detected = Operations Initiated (blue boxes)

2. Operational Strategy Based on Change Characteristics

Change Detection → Operational Need Assessment → Appropriate Response
  • Normal Changes → Standard operational activities
  • Anomalies → Immediate response operations
  • Real-time Events → Emergency operational procedures

3. Cyclical Structure Based on Operational Outcomes

  • Maintenance: Stable operations maintained through proper change management
  • Fault/Big Cost: Increased costs due to inadequate response to changes

Key Insights

“Change Determines Operations”

  1. System without change = No intervention required
  2. System with change = Operational activity mandatory
  3. Early change detection = Efficient operations
  4. Proper change classification = Optimized resource allocation

Operational Paradigm

This diagram demonstrates the evolution from Reactive Operations to Proactive Operations, where:

  • Traditional Approach: Wait for problems → React
  • Modern Approach: Detect changes → Predict → Respond proactively

The framework recognizes change as the trigger for all operational activities, embodying the contemporary IT operations paradigm where:

  • Operations are event-driven rather than schedule-driven
  • Intelligence (AI/Analytics) transforms raw change data into actionable insights
  • Automation ensures appropriate responses to different types of changes

This represents a shift toward Change-Driven Operations Management, where the operational workload directly correlates with the rate and nature of system changes, enabling more efficient resource utilization and better service reliability.

With Claude

Together is not easy

This infographic titled “Together” emphasizes the critical importance of parallel processing = working together across all domains – computing, AI, and human society.

Core Concept:

The Common Thread Across All 5 Domains – ‘Parallel Processing’:

  1. Parallel Processing – Simultaneous task execution in computer systems
  2. Deep Learning – AI’s multi-layered neural networks learning in parallel
  3. Multi Processing – Collaborative work across multiple processors
  4. Co-work – Human collaboration and teamwork
  5. Social – Collective cooperation among community members

Essential Elements of Parallel Processing:

  • Sync (Synchronization) – Coordinating all components to work harmoniously
  • Share (Sharing) – Efficient distribution of resources and information
  • Optimize (Optimization) – Maximizing performance while minimizing energy consumption
  • Energy (Energy) – The inevitable cost required when working together

Reinterpreted Message: “togetherness is always difficult, but it’s something we have to do.”

This isn’t merely about the challenges of cooperation. Rather, it conveys that parallel processing (working together) in all systems requires high energy costs, but only through optimization via synchronization and sharing can we achieve true efficiency and performance.

Whether in computing systems, AI, or human society – all complex systems cannot advance without parallel cooperation among individual components. This is an unavoidable and essential process for any sophisticated system to function and evolve. The insight reveals a fundamental truth: the energy investment in “togetherness” is not just worthwhile, but absolutely necessary for progress.

With Claude

CPU with GPU (legacy)

This image is a diagram explaining the data transfer process between CPU and GPU. Let me interpret the main components and processes.

Key Components

Hardware:

  • CPU: Main processor
  • GPU: Graphics processing unit (acting as accelerator)
  • DRAM: Main memory on CPU side
  • VRAM: Dedicated memory on GPU side
  • PCIe: High-speed interface connecting CPU and GPU

Software/Interfaces:

  • Software (Driver/Kernel): Driver/kernel controlling hardware
  • DMA (Direct Memory Access): Direct memory access

Data Transfer Process (4 Steps)

Step 1 – Data Preparation

  • CPU first writes data to main memory (DRAM)

Step 2 – DMA Transfer

  • Copy data from main memory to GPU’s VRAM via PCIe
  • ⚠️ Wait Time: Cache Flush – CPU cache is flushed before accelerator can access the data

Step 3 – Task Execution

  • GPU performs tasks using the copied data

Step 4 – Result Copy

  • After task completion, GPU copies results back to main memory
  • ⚠️ Wait Time: Synchronization – CPU must perform another synchronization operation before it can read the results

Performance Considerations

This diagram shows the major bottlenecks in CPU-GPU data transfer:

  • Memory copy overhead: Data must be copied twice (CPU→GPU, GPU→CPU)
  • Synchronization wait times: Synchronization required at each step
  • PCIe bandwidth limitations: Physical constraints on data transfer speed

CXL-based Improvement Approach

CXL (Compute Express Link) shown on the right side of the diagram represents next-generation technology for improving this data transfer process, offering an alternative approach to solve the complex 4-step process and related performance bottlenecks.


Summary

This diagram demonstrates how CPU-GPU data transfer involves a complex 4-step process with performance bottlenecks caused by memory copying overhead, synchronization wait times, and PCIe bandwidth limitations. CXL is presented as a next-generation technology solution that can overcome the limitations of traditional data transfer methods.

With Claude

Human Extends

This image is a conceptual diagram titled “Human Extend” that illustrates the cognitive extension of human capabilities and the role of AI tools.

Core Concept

“Human See” at the center represents the core of human observation and understanding abilities.

Bidirectional Extension Structure

Left: Macro Perspective

  • Represented by an orange circle
  • “A deeper understanding of the micro leads to better macro predictions”

Right: Micro Perspective

  • Represented by a blue circle
  • “A deeper understanding of the macro leads to better micro predictions”

Role of AI and Data

The upper portion shows two supporting tools:

  1. AI (by Tool): Represented by an atomic structure-like icon
  2. Data (by Data): Represented by network and database icons

Overall Meaning

This diagram visually represents the concept that human cognitive abilities can be extended through AI tools and data analysis, enabling deeper mutual understanding between microscopic details and macroscopic patterns. It illustrates the complementary relationship where understanding small details leads to better prediction of the big picture, and understanding the big picture leads to more accurate prediction of details.

The diagram suggests that AI and data serve as amplifying tools that enhance human perception, allowing for more sophisticated analysis across different scales of observation and prediction.

with Claude