Many Simple with THE AI

From Claude with some prompting
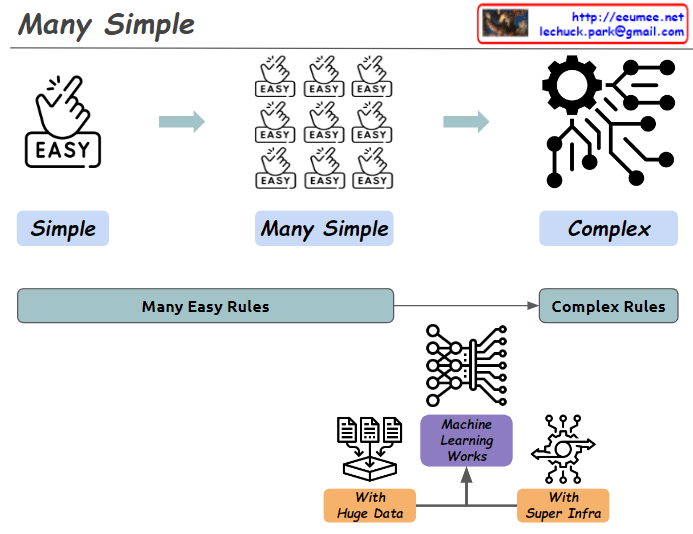
This image illustrates the concept of “Many Simple” and demonstrates how simple elements combine to create complexity.

  1. Top diagram:
    • “Simple”: Starts with a single “EASY” icon.
    • “Many Simple”: Shows multiple “EASY” icons grouped together.
    • “Complex”: Depicts a system of intricate gears and connections.
  2. Bottom diagram:
    • Shows the progression from “Many Easy Rules” to “Complex Rules”.
    • Centers around the concept of “Machine Learning Works”.
    • This is supported by “With Huge Data” and “With Super Infra”.

The image provides a simplified explanation of how machine learning operates. It visualizes the process of numerous simple rules being processed through massive amounts of data and powerful infrastructure to produce complex systems.

No More data

From Claude with some prompting
This image illustrates a flowchart about data and the learning process. Here’s a breakdown of the key elements:

  1. The title “No More Data” is at the top of the image.
  2. “Data in” section includes:
    • Experience: represented by a history icon
    • Number: shown as dice with 1, 2, 3
    • Text: represented by “IT” letters
    • Book: depicted by a book icon
    • Internet: symbolized by a global network icon
  3. These data sources feed into a “Learning & Learning” process, leading to a learning output represented by an icon resembling artificial intelligence or a brain.
  4. There’s a stage labeled “No More Data”, followed by the question “And the Next ??”
  5. Finally, there’s a lightbulb icon suggesting “New Creation?”

This diagram visualizes the process from data input to learning, and then poses the question of what happens when there’s no more data. It suggests the possibility of new creation as the next step. The flowchart prompts consideration of what follows after the learning phase when data input ceases, and whether this could lead to novel creation.

What to do first

From Claude with some prompting
This image outlines a progressive approach to data monitoring and alert systems, starting with simple metrics and evolving to more complex AI-driven solutions. The key steps are:

  1. “Keeping a Temperature”: Basic monitoring of system temperatures.
  2. “Monitoring”: Continuous observation of temperature data.
  3. “Alerts with thresholds”: Simple threshold-based alerts.
  4. More complex metrics: Including 10-minute thresholds, change counts, averages, and derivations.
  5. “More Indicators”: Expanding to additional KPIs and metrics.
  6. “Machine Learning ARIMA/LSTM”: Implementing advanced predictive models.
  7. “Alerts with predictions”: AI-driven predictive alerts.

The central message “EASY FIRST BEFORE THE AI !!” emphasizes starting with simpler methods before advancing to AI solutions.

Importantly, the image also implies that these simpler metrics and indicators established early on will later serve as valuable training data for AI models. This is shown by the arrows connecting all stages to the machine learning component, suggesting that the data collected throughout the process contributes to the AI’s learning and predictive capabilities.

This approach not only allows for a gradual build-up of system complexity but also ensures that when AI is implemented, it has a rich dataset to learn from, enhancing its effectiveness and accuracy.

Easy Prediction

From Claude with some prompting
This image illustrates three main approaches to prediction and pattern recognition.

First, for easy prediction, a linear regression model (Linear Regression, y=ax+b) can be used. This is represented by a simple upward trendline. While a basic concept, it is emphasized that this can cover 90% of cases.

Second, for learning complex patterns that recur over time, an AI model is required. This is depicted by the jagged line shape.

Third, for real-time anomaly detection, sudden spike patterns need to be identified.

Additionally, at the bottom of the image, a new phrase has been added: “More & More & More learning makes More & More & More better AI model.” This conveys the idea that as an AI model learns from more and more data, its performance continues to improve.

In summary, the image highlights a step-by-step approach: starting with simple concepts to build a foundation, then utilizing AI models to learn complex patterns, and continuously improving the models through ongoing data learning and training. The key emphasis is on starting with the basics, while recognizing the potential of advanced AI techniques when combined with extensive learning from data.

the key components of a Mixture of Experts

From Claude with some prompting
This image illustrates the key components of a Mixture of Experts (MoE) model architecture. An MoE model combines the outputs of multiple expert networks to produce a final output.

The main components are:

  1. Expert Network: This represents a specialized neural network trained for a specific task or inputs. Multiple expert networks can exist in the architecture.
  2. Weighting Scheme: This component determines how to weight and combine the outputs from the different expert networks based on the input data.
  3. Routing Algorithm: This algorithm decides which expert network(s) should handle a given input based on the specific inputs. It essentially routes the input data to the appropriate expert(s).

The workflow is as follows: The specific inputs are fed into the routing algorithm (3), which decides which expert network(s) should process those inputs. The selected expert network(s) (1) process the inputs and generate outputs. The weighting scheme (2) then combines these expert outputs into a final output based on a small neural network.

The key idea is that different expert networks can specialize in different types of inputs or tasks, and the MoE architecture can leverage their collective expertise by routing inputs to the appropriate experts and combining their outputs intelligently.

Trend & Prediction

From Claude with some prompting
The image presents a “Trend & Predictions” process, illustrating a data-driven prediction system. The key aspect is the transition from manual validation to automation.

  1. Data Collection & Storage: Digital data is gathered from various sources and stored in a database.
  2. Manual Selection & Validation: a. User manually selects which metric (data) to use b. User manually chooses which AI model to apply c. Analysis & Confirmation using selected data and model
  3. Transition to Automation:
    • Once optimal metrics and models are confirmed in the manual validation phase, the system learns and switches to automation mode. a. Automatically collects and processes data based on selected metrics b. Automatically applies validated models c. Applies pre-set thresholds to prediction results d. Automatically detects and alerts on significant predictive patterns or anomalies based on thresholds

The core of this process is combining user expertise with system efficiency. Initially, users directly select metrics and models, validating results to “educate” the system. This phase determines which data is meaningful and which models are accurate.

Once this “learning” stage is complete, the system transitions to automation mode. It now automatically collects, processes data, and generates predictions using user-validated metrics and models. Furthermore, it applies preset thresholds to automatically detect significant trend changes or anomalies.

This enables the system to continuously monitor trends, providing alerts to users whenever important changes are detected. This allows users to respond quickly, enhancing both the accuracy of predictions and the efficiency of the system.

CPU & GPU Works

From Claude with some prompting
This image explains the working principles of CPU (Central Processing Unit) and GPU (Graphics Processing Unit) in a visual manner.

  1. Data Types:
    • Scalar: A single value
    • Vector: One-dimensional array
    • Matrix: Two-dimensional array
    • Tensor: Multi-dimensional array
  2. CPU Work Method:
    • Sequential processing, denoted by ’01’
    • Tasks are processed in order, as shown by 1, 2, 3, 4, 5
    • Primarily handles scalar data, processing complex tasks sequentially
  3. GPU Work Method:
    • Parallel processing, represented by a matrix
    • Icons show multiple tasks being processed simultaneously
    • Mainly deals with multi-dimensional data like matrices or tensors, processing many tasks in parallel

The image demonstrates that while CPUs process tasks sequentially, GPUs can handle many tasks simultaneously in parallel. This helps explain which processing unit is more efficient based on the complexity and volume of data. Complex and large-scale data (matrices, tensors) are better suited for GPUs, while simple, sequential tasks are more appropriate for CPUs.