Digitalization

From DALL-E with some prompting
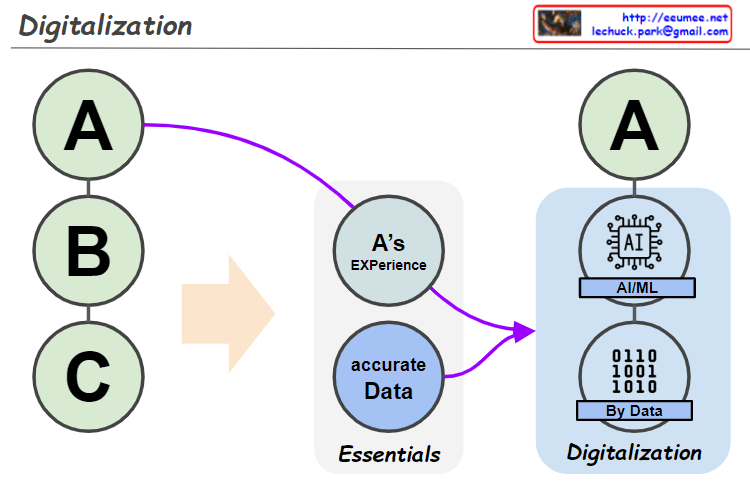
The image depicts three levels of experience, A, B, and C, highlighting that while A represents a high level of experience, levels B and C can be enhanced through digital transformation using data and AI technologies. This transformation underscores that the collection and analysis of accurate data are essential elements, as they lay the foundation for AI systems to perform sophisticated learning, thus improving operational efficiency and precision.

The integration of individual experiences and precise data is not merely a technical shift but also prompts significant changes in human resource management within organizations. By incorporating their expertise into digital platforms, employees can strengthen the organization’s knowledge base and contribute to their own professional development.

Ultimately, this digital transformation should be sustainable and maintain a human-centric approach, ensuring that the increase in operational efficiency through AI alleviates the workload on employees, fostering creativity and enhancing the organizational culture and values.


Digital Twin

From DALL-E with some prompting
This image depicts a conceptual diagram for a “Digital Twin.”

  • In the top left, there’s an icon representing a physical object, resembling the Earth with dots and lines, indicating complexity and connectivity.
  • A rightward arrow from the object leads to a phrase “Everything to Digit,” suggesting the transformation of a physical object into digital data.
  • The top right block is filled with binary codes, representing digital information.
  • Next to this block, there’s an icon of a clock with the phrase “with time simulation,” indicating the process includes temporal changes or predictions over time.
  • An arrow points downward to the phrase “Real Model,” signifying the creation of a practical model from the digital information and simulations.
  • At the bottom, there’s a 3D cube labeled “3D,” symbolizing the digital twin’s realization as a three-dimensional model.

A digital twin is a virtual replica of a physical object or system, bridging the physical and digital worlds. It can be used for real-time analytics, system monitoring, troubleshooting, and predictive maintenance. The diagram visually represents the process of creating a digital twin, omitting personal or organizational contact information that is present in the image.

Anomaly Traffic Detection#1

From DALL-E with some prompting
The flowchart illustrates a four-step network anomaly detection process:

  1. Data Collection: Gather various types of network data.
  2. Protocol Usage: Employ SNMP, SFLOW/NETFLOW, and other methods to extract the data.
  3. Analysis: Analyze Ethernet and TCP/IP header data for irregularities.
  4. Control: Implement countermeasures like blocking traffic or controlling specific IP addresses.

The expected benefits of this process include enhanced network security through early detection of anomalies, the ability to prevent potential breaches by blocking suspicious traffic, and improved network management via real-time analysis and control.

Start Regression (ML)

From DALL-E with some prompting

Linear Regression:
Yields a continuous output.
Relates independent variable X with dependent variable Y through a linear relationship.
Uses Mean Squared Error (MSE) as a performance metric.
Can be extended to Multi-linear Regression for multiple independent variables.

Linear & Logistic Regression

  • The process begins with data input, as indicated by “from Data.”
  • Machine learning algorithms then process this data.
  • The outcome of this process branches into two types of regression, as indicated by “get Functions.”

Logistics Regression:
Used for classification tasks, distinguishing between two or more categories.
Outputs a probability percentage (between 0 or 1) indicating the likelihood of belonging to a particular class.
Performance is evaluated using Log Loss or Binary Cross-Entropy metrics.
Can be generalized to Softmax/Multinomial Logistic Regression for multi-class classification problems.

The image also graphically differentiates the two types of regression. Linear Regression is represented with a scatter plot and a trend line indicating the predictive linear equation. Logistic Regression is shown with a sigmoid function curve that distinguishes between two classes, highlighting the model’s ability to classify data points based on the probability threshold.

Processing UNIT

From DALL-E With some prompting

Processing Unit

  • CPU (Central Processing Unit): Central / General
    • Cache/Control Unit (CU)/Arithmetic Logic Unit (ALU)/Pipeline
  • GPU (Graphics Processing Unit): Graphic
    • Massive Parallel Architecture
    • Stream Processor & Texture Units and Render Output Units
  • NPU (Neural Processing Unit): Neural (Matrix Computation)
    • Specialized Computation Units
    • High-Speed Data Transfer Paths
    • Parallel Processing Structure
  • DPU (Data Processing Unit): Data
    • Networking Capabilities & Security Features
    • Storage Processing Capabilities
    • Virtualization Support
  • TPU (Tensor Processing Unit): Tensor
    • Tensor Cores
    • Large On-Chip Memory
    • Parallel Data Paths

Additional Information:

  • NPU and TPU are differentiated by their low power, specialized AI purpose.
  • TPU is developed by Google for large AI models in big data centers and features large on-chip memory.

The diagram emphasizes the specialized nature of NPU and TPU for AI tasks, highlighting their low power consumption and specialized computation capabilities, particularly for neural and tensor computations. It also contrasts these with the more general-purpose capabilities of CPUs and the graphic processing orientation of GPUs. DPU is presented as specialized for handling data-centric tasks involving networking, security, and storage in virtualized environments.

Network Monitoring with AI

from DALL-E with some prompting
The image portrays a network monitoring system enhanced by AI, specifically utilizing deep learning. It shows a flow from the network infrastructure to the identification of an event, characterized by computed data with time information and severity. The “One Event” is clearly defined to avoid ambiguity. The system identifies patterns such as the time gap between events, event count, and relationships among devices and events, which are crucial for a comprehensive network analysis. AI deep learning algorithms work to process additional data (add-on data) and ambient data to detect anomalies and support predictive maintenance within the network.

Works with data

From DALL-E with some prompting
The image describes a data workflow process that involves various stages of data handling and utilization for operational excellence. “All Data” from diverse sources feeds into a monitoring system, which then processes raw data, including work logs. This raw data undergoes ETL (Extract, Transform, Load) procedures to become structured “ETL-ed Data.” Following ETL, the data is analyzed with AI to extract insights and inform decisions, which can lead to actions such as maintenance. The ultimate goal of this process is to achieve operational excellence, automation, and efficiency.