optimization

From Claude with some prompting

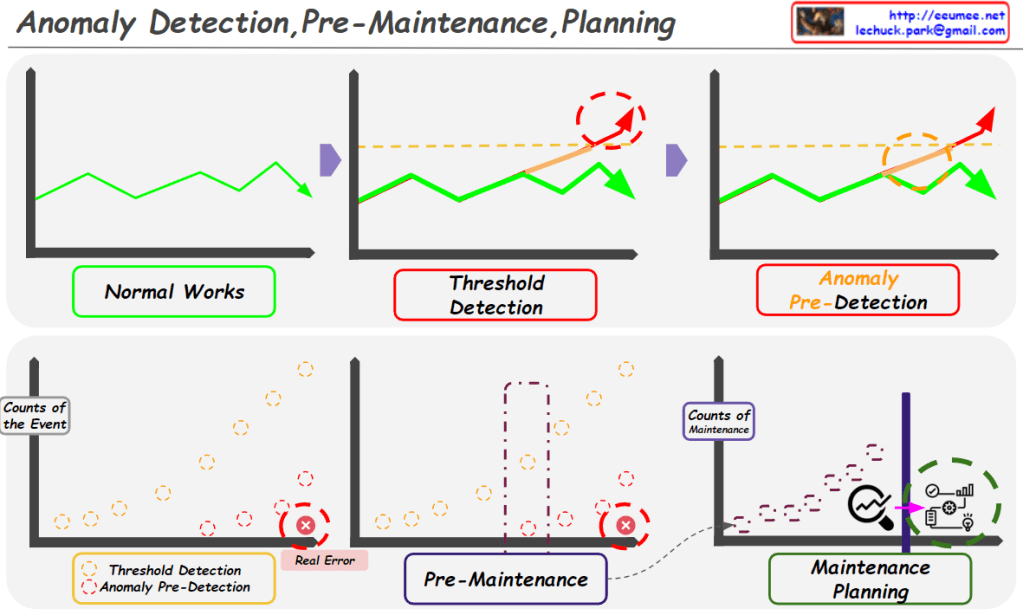
  1. “Just look (the average of usage)”:
    • This stage shows a simplistic view of usage based on rough averages.
    • The supply (green arrow) is generously provided based on this average usage.
    • Actual fluctuations in usage are not considered at this point.
  2. “More Details of Usages”:
    • Upon closer inspection, continuous variations in actual usage are discovered.
    • The red dotted circle highlights these subtle fluctuations.
    • At this stage, variability is recognized but not yet addressed.
  3. “Optimization”:
    • After recognizing the variability, optimization is attempted based on peak usage.
    • The dashed green arrow indicates the supply level set to meet maximum usage.
    • Light green arrows show excess supply when actual usage is lower.
  4. “Changes of usage”:
    • Over time, usage variability increases significantly.
    • The red dotted circle emphasizes this increased volatility.
  5. “Unefficient”:
    • This demonstrates how maintaining a constant supply based on peak usage becomes inefficient when faced with high variability.
    • The orange shaded area visualizes the large gap between actual usage and supply, indicating the degree of inefficiency.
  6. “Optimization”:
    • Finally, optimization is achieved through flexible supply that adapts to actual usage patterns.
    • The green line closely matching the orange line (usage) shows supply being adjusted in real-time to match usage.
    • This approach minimizes oversupply and efficiently responds to fluctuating demand.

This series illustrates the progression from a simplistic average-based view, through recognition of detailed usage patterns, to peak-based optimization, and finally to flexible supply optimization that matches real-time demand. It demonstrates the evolution towards a more efficient and responsive resource management approach.

Service Development Env.

From Claude with some prompting
This image shows a diagram titled “Service Development Env.” (Service Development Environment). It illustrates the stages of a service development process:

  1. Facility: Represented by a building icon, serving as the starting point.
  2. Legacy System: Depicted by a computer screen icon.
  3. Collection: Shown as multiple document icons.
  4. ETL (Extract, Transform, Load): Represented by gear and database icons.
  5. Analysis: Indicated by a magnifying glass icon, including visualization and AI prediction capabilities.
  6. Deploy: Represented by a screen icon with charts, described as “Service = Data + Chart”.

The lower part of the diagram shows additional process steps:

  • Metrics: Includes Configurations.
  • Time Series: Stores data in (id, value, time) format.
  • Tags
  • Roll-Up & TSDB Agg (Time Series Database Aggregation)
  • Prompt with Charts

Overall, this diagram illustrates the entire service development process from data collection to analysis, visualization, and final service deployment. Each stage represents the steps of processing, storing, analyzing data, and ultimately delivering it to end-users.

The flow suggests a progression from legacy systems and facilities, through data collection and processing, to advanced analysis and deployment of data-driven services

Standardization & Platform Why?

From Claude with some prompting
This diagram illustrates the importance of standardization and platform development, highlighting two key objectives:

  1. Standardization:
    • Encompasses the stages from real work (machine and processing) through digitization, collecting, and verification.
    • Purpose: “Move on with data trust”
    • Meaning: By establishing standardized processes for data collection and verification, it ensures data reliability. This allows subsequent stages to proceed without concerns about data quality.
  2. Software Development Platform:
    • Includes analysis, improvement, and new development stages.
    • Purpose: “Make easy to improve & go to new”
    • Meaning: Building on standardized data and processes, the platform facilitates easier service improvements and new service development and expansion.

This structure offers several advantages:

  1. Data Reliability: Standardized processes for collection and verification ensure trustworthy data, eliminating concerns about data quality in later stages.
  2. Efficient Improvement and Innovation: With reliable data and a standardized platform, improving existing services or developing new ones becomes more straightforward.
  3. Scalability: The structure provides a foundation for easily adding new services or features.

In conclusion, this diagram visually represents two core strategies: establishing data reliability through standardization and enabling efficient service improvement and expansion through a dedicated platform. It emphasizes how standardization allows teams to trust and focus on using the data, while the platform makes it easier to improve existing services and develop new ones.

“if then” by AI

From Claude with some prompting
This image titled “IF THEN” by AI illustrates the evolution from traditional programming to modern AI approaches:

  1. Upper section – “Programming”: This represents the traditional method. Here, programmers collect data, analyze it, and explicitly write “if-then” rules. This process is labeled “Making Rules”.
    • Data collection → Analysis → Setting conditions (IF) → Defining actions (THEN)
  2. Lower section – “AI”: This shows the modern AI approach. It uses “Huge Data” to automatically learn patterns through machine learning algorithms.
    • Large-scale data → Machine Learning → AI model generation

Key differences:

  • Traditional method: Programmers explicitly define rules
  • AI method: Automatically learns patterns from data to create AI models that include basic “if-then” logic

The image effectively diagrams the shift in programming paradigms. It demonstrates how AI can process and learn from massive datasets to automatically generate logic that was previously manually defined by programmers.

This visualization succinctly captures how AI has transformed the approach to problem-solving in computer science, moving from explicit rule-based programming to data-driven, pattern-recognizing models.

Time Series Data ETL

From Claude with some prompting
This image illustrates the “Time Series Data ETL” (Extract, Transform, Load) process.

Key components of the image:

  1. Time Series Data structure:
    • Identification (ID): Data identifier
    • Value (Metric): Measured value
    • Time: Timestamp
    • Tags: Additional metadata
  2. ETL Process:
    • Multiple source data points go through the Extract, Transform, Load process to create new transformed data.
  3. Data Transformation:
    • New ID: Generation of a new identifier
    • avg, max, min…: Statistical calculations on values (average, maximum, minimum, etc.)
    • Time Range (Sec, Min): Time range adjustment (in seconds, minutes)
    • all tags: Combination of all tag information

This process demonstrates how raw time series data is collected, transformed as needed, and prepared into a format suitable for analysis or storage. This is a crucial step in large-scale data processing and analysis.

The diagram effectively shows how multiple data points with IDs, values, timestamps, and tags are consolidated and transformed into a new data structure with aggregated information and adjusted time ranges.

Anomaly Detection,Pre-Maintenance,Planning

From Claude with some prompting
This image illustrates the concepts of Anomaly Detection, Pre-Maintenance, and Planning in system or equipment management.

Top section:

  1. “Normal Works”: Shows a graph representing normal operational state.
  2. “Threshold Detection”: Depicts the stage where anomalies exceeding a threshold are detected.
  3. “Anomaly Pre-Detection”: Illustrates the stage of detecting anomalies before they reach the threshold.

Bottom section:

  1. “Threshold Detection Anomaly Pre-Detection”: A graph showing both threshold detection and pre-detection of anomalies. It captures anomalies before a real error occurs.
  2. “Pre-Maintenance”: Represents the pre-maintenance stage, where maintenance work is performed after anomalies are detected.
  3. “Maintenance Planning”: Shows the maintenance planning stage, indicating continuous monitoring and scheduled maintenance activities.

The image demonstrates the process of:

  • Detecting anomalies early in normal system operations
  • Implementing pre-maintenance to prevent actual errors
  • Developing systematic maintenance plans

This visual explanation emphasizes the importance of proactive monitoring and maintenance to prevent failures and optimize system performance.

Standardization for DCIM

From Claude with some prompting
Data Standardization:

  • Defined a clear process for systematically collecting data from equipment.
  • Proposed an integrated data management approach, including network topology and interfacing between various systems.
  • Emphasized data quality management as a key factor to establish a reliable data foundation.

Service Standardization:

  • Structured the process of connecting data to actual services.
  • Highlighted practical service implementation, including monitoring services and automation tasks.
  • Specified AI service requirements, showing a forward-looking approach.
  • Established a foundation for continuous service improvement by including service analysis and development processes.

Commissioning Standardization:

  • Emphasized verification plans and documentation of results at each stage of design, construction, and operation to enable quality management throughout the entire lifecycle.
  • Prepared an immediate response system for potential operational issues by including real-time data error verification.
  • Considered system scalability and flexibility by incorporating processes for adding facilities and data configurations.

Overall Evaluation:

This DCIM standardization approach comprehensively addresses the core elements of data center infrastructure management. The structured process, from data collection to service delivery and continuous verification, is particularly noteworthy. By emphasizing fundamental data quality management and system stability while considering advanced technologies like AI, the approach is both practical and future-oriented. This comprehensive framework will be a valuable guideline for the implementation and operation of DCIM.