Software Defined Power Distribution

With a Claude
the Software Defined Power Distribution (SDPD) system, including the added standards and protocols shown in the image:

  1. SDN Similarity
  • Like Software-Defined Networking controls network traffic, SDPD applies similar software-defined principles to power distribution
  1. Key Components
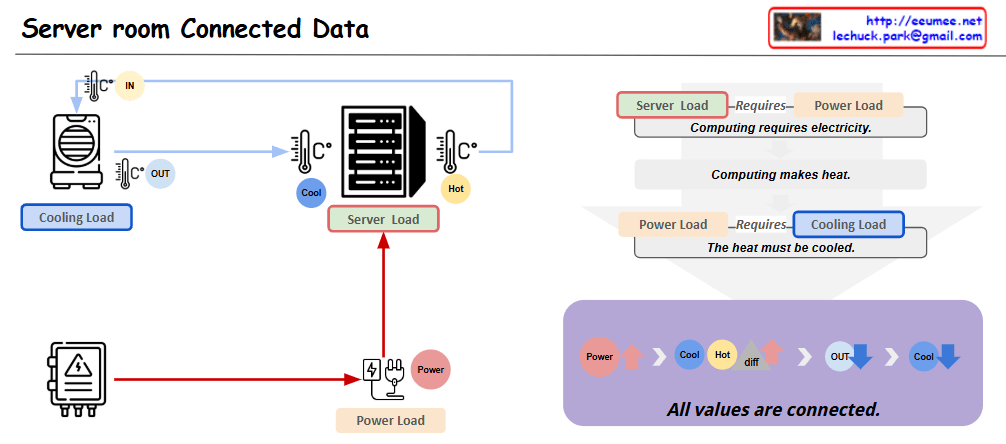
  • Real-time Monitoring: Power consumption and system status analysis using IoT sensors and AI
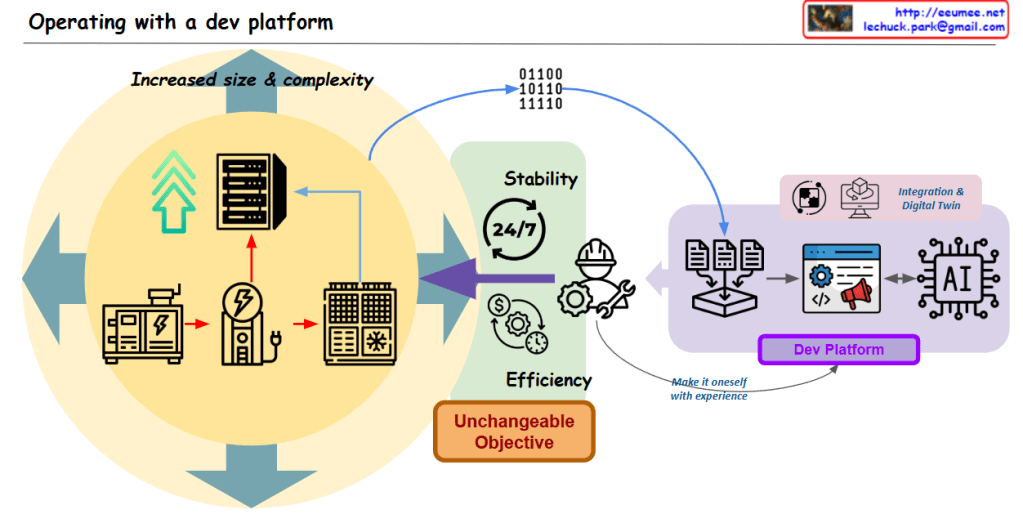
  • Centralized Control: Power distribution optimization through an integrated platform
  • Flexibility/Scalability: Software-based upgrades and expansion
  • Energy Efficiency: Data center power optimization and rapid fault response
  1. Standards and Protocols
  • IEC 61850: Substation automation communication standard
  • IEEE 2030.5: Smart energy profile standard
  • Modbus/DNP3: Industrial communication protocols
  • OpenADR: Automated demand response standard

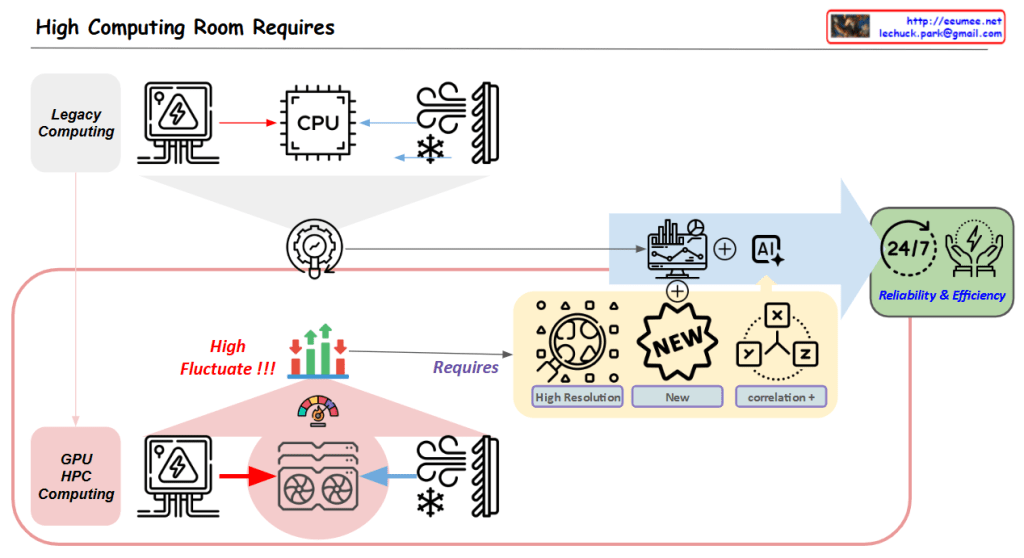
Final Summary: Why Software Defined X (SDx) is necessary for power distribution

  • Modern power systems face increasing complexity and require real-time response capabilities
  • Data-driven decision making and automated control are essential
  • Software Defined approach (SDPD) provides:
    1. Real-time data collection/analysis for optimized power flow
    2. Rapid response and efficient management through centralized control
    3. Flexible system expansion and upgrades through software-based architecture
    4. Achievement of improved energy efficiency and reduced operational costs

The software-defined approach has become essential in the power sector, just as it has in networking, because it enables:

  • Intelligent resource allocation
  • Improved system visibility
  • Enhanced operational efficiency
  • Better fault tolerance and recovery
  • Cost-effective scaling and updates

This demonstrates why a data-centric, software-defined approach is crucial for modern power systems to achieve efficiency, reliability, and scalability.

Server Room Metric Correlation

With Claude
Server Room Metric Correlation Analysis & Operations Guide

1. Diagram Structure Analysis

Key Component Areas

  1. Server Zone (Left)
  • Server racks and equipment
  • Workload-driven CPU/GPU operations
  • Load metrics indicating rising system demands
  • Resource utilization monitoring
  1. Power Supply Zone (Center Bottom)
  • Power metering system
  • Power consumption monitoring
  • Load status tracking with increasing indicators
  1. Hot Zone (Center)
  • Heat generation and thermal management area
  • Exhaust temperature monitoring
  • Return temperature tracking
  • Overall temperature management
  1. Cool Zone (Right)
  • Cooling system operations
  • Inlet temperature control
  • Cooling supply temperature management
  • Cooling system load monitoring

2. Core Metric Correlations

Basic Metric Flow

  1. Load Generation
  • Server workload increases
  • CPU/GPU utilization rises
  • System load elevation
  1. Power Consumption
  • Load-driven power usage increase
  • Power efficiency monitoring
  • Overall system load tracking
  1. Thermal Management
  • Heat generation in Hot Zone
  • Exhaust/Return temperature differential
  • Cooling system response
  1. Cooling Efficiency
  • Cool Zone temperature regulation
  • Cooling system load adjustment
  • System stability maintenance

3. Key Operational Indicators

Primary Metrics

  1. Performance Metrics
  • Server workload levels
  • CPU/GPU utilization
  • System response metrics
  1. Environmental Metrics
  • Zone temperatures
  • Air flow patterns
  • Cooling efficiency
  1. Power Metrics
  • Power consumption rates
  • Load distribution
  • Efficiency indicators

4. Monitoring Focus Points

Critical Correlations

  1. Load-Power-Temperature Relationship
  • Workload impact on power consumption
  • Heat generation patterns
  • Cooling system response efficiency
  1. System Stability Indicators
  • Temperature zone balance
  • Power distribution effectiveness
  • Cooling system performance

This comprehensive analysis of server room metrics and their correlations enables effective monitoring and management of the entire system, ensuring optimal performance and stability through understanding the interconnected nature of all components and their respective metrics.

The diagram effectively illustrates how different metrics interact and influence each other, providing a clear framework for monitoring and maintaining server room operations efficiently.

High Computing Room Requires

With a Claude’s Help
Core Challenge:

  1. High Variability in GPU/HPC Computing Room
  • Dramatic fluctuations in computing loads
  • Significant variations in power consumption
  • Changing cooling requirements

Solution Approach:

  1. Establishing New Data Collection Systems
  • High Resolution Data: More granular, time-based data collection
  • New Types of Data Acquisition
  • Identification of previously overlooked data points
  1. New Correlation Analysis
  • Understanding interactions between computing/power/cooling
  • Discovering hidden patterns among variables
  • Deriving predictable correlations

Objectives:

  • Managing variability through AI-based analysis
  • Enhancing system stability
  • Improving overall facility operational efficiency

In essence, the diagram emphasizes that to address the high variability challenges in GPU/HPC environments, the key strategy is to collect more precise and new types of data, which enables the discovery of new correlations, ultimately leading to improved stability and efficiency.

This approach specifically targets the inherent variability of GPU/HPC computing rooms by focusing on data collection and analysis as the primary means to achieve better operational outcomes.

Server room Connected Data

with a claude’s help
This diagram represents the key interconnected elements within a server room in a data center. It is composed of three main components:

  1. Server Load: This represents the computing processing demand on the server hardware.
  2. Cooling Load: This represents the cooling system’s load required to remove the heat generated by the server equipment.
  3. Power Load: This represents the electrical power demand needed to operate the server equipment.

These three elements are closely related. As the Server Load increases, the Power Load increases, which then leads to greater heat generation and an increase in Cooling Load.

Applying this to an actual data center environment, important considerations would include:

  1. Server rack placement: Efficient rack arrangement to optimize cooling performance and power distribution.
  2. Hot air exhaust channels: Dedicated pathways to effectively expel the hot air from the server racks, reducing Cooling Load.
  3. Cooling system capacity: Sufficient CRAC (Computer Room Air Conditioning) units to handle the Cooling Load.
  4. Power supply: Appropriate PDU (Power Distribution Unit) to provide the necessary Power Load for stable server operation.

By accounting for these real-world data center infrastructure elements, the diagram can be further enhanced to provide more practical and applicable insights.

Overall, this diagram effectively illustrates the core interdependent components within a server room and how they relate to the actual data center operational environment.Copy

PUE Details

With a Claude’s Help
This image provides detailed information on Power Usage Effectiveness (PUE), a key metric for measuring the energy efficiency of a data center.

The overall structure shows that power received from the High Power Receiver is distributed to various components, including IT equipment and cooling systems, through the Power Distributor.

To calculate PUE, several granular metrics are required, such as IT power, cooling power, and total power consumption. These detailed items are grouped into larger categories for easier management and standardization.

For example, IT power is further broken down into servers, storage, and network equipment. Cooling power includes CRAC units, cooling towers, and pump systems. The power supply stages are also differentiated to identify points of power loss.

Furthermore, detailed monitoring of individual IT and cooling equipment power consumption enables more accurate PUE calculation and optimization.

In summary, effective PUE management requires categorizing the total power usage into IT power, cooling power, and other power, and then further subdividing these groups into standardized, measurable components. Real-time monitoring and data analysis are crucial for continually improving energy efficiency in the data center.

Operating with a dev Platform

with a Claude’s help
The main points covered in this image are:

  1. Increased Size and Complexity of Data
  • The central upward-pointing arrow indicates that the size and complexity of data is increasing.
  1. Key Operational Objectives
  • The three main operational goals presented are Stability, Efficiency, and an “Unchangeable Objective”.
  • Stability is represented by the 24/7 icon, indicating the need for continuous, reliable operation.
  • Efficiency is depicted through various electrical/mechanical icons, suggesting the need for optimized resource utilization.
  • The “Unchangeable Objective” is presented as a non-negotiable goal.
  1. Integration, Digital Twin, and AI-based Development Platform
  • To manage the increasing data and operations, the image shows the integration of technologies like Digital Twin.
  • An AI-powered Development Platform is also illustrated, which can “make it [the operations] itself with experience”.
  • This Development Platform seems to leverage AI to help achieve the stability, efficiency, and unchangeable objectives.
  1. Interconnected Elements
  • The image demonstrates the interconnected nature of the growing data, the key operational requirements, and the technological solutions.
  • The Development Platform acts as a hub, integrating data and AI capabilities to support the overall operational goals.

In summary, this image highlights the challenges posed by the increased size and complexity of data that organizations need to manage. It presents the core operational objectives of stability, efficiency, and immutable goals, and suggests that an integrated, AI-powered development platform can help address these challenges by leveraging the synergies between data, digital technologies, and autonomous problem-solving capabilities.

RON ( Routed Optical Networking )

From Claude with some prompting
This image provides an overview of Routed Optical Networking (RON), which is a networking technology that combines IP routing and MPLS with wavelength multiplexing to enable very long distance data transmission.

The key features highlighted in the image are:

  1. Network simplification: RON reduces the complex hierarchy of routers and transmission equipment traditionally used in optical networks.
  2. Cost-effectiveness: RON eliminates the need for separate transmission equipment, reducing hardware and maintenance costs.
  3. Reduced latency: Data is processed within a single device, rather than going through multiple devices, reducing latency.
  4. Operational efficiency: Routing and transport functions are consolidated, allowing the network to be managed from a single management platform.

The image also shows the main components of a RON system, including IP routing + MPLS, wavelength multiplexing, L3 layer, physical layer, router, and DWDM (Dense Wavelength Division Multiplexing). It also lists some specific technologies used, such as IP over Dense, Wavelength Division Multiplexing (Juniper) and Photonic Service Engine (Nokia).

Overall, this diagram illustrates how RON simplifies optical networking by combining multiple networking functions into a more efficient and cost-effective architecture.Copy