3 Computing in AI

AI Computing Architecture

3 Processing Types

1. Sequential Processing

  • Hardware: General CPU (Intel/ARM)
  • Function: Control flow, I/O, scheduling, Data preparation
  • Workload Share: Training 5%, Inference 5%

2. Parallel Stream Processing

  • Hardware: CUDA core (Stream process)
  • Function: FP32/FP16 Vector/Scalar, memory management
  • Workload Share: Training 10%, Inference 30%

3. Matrix Processing

  • Hardware: Tensor core (Matrix core)
  • Function: Mixed-precision (FP8/FP16) MMA, Sparse matrix operations
  • Workload Share: Training 85%+, Inference 65%+

Key Insight

The majority of AI workloads are concentrated in matrix processing because matrix multiplication is the core operation in deep learning. Tensor cores are the key component for AI performance improvement.

With Claude

‘IF THEN’ with AI

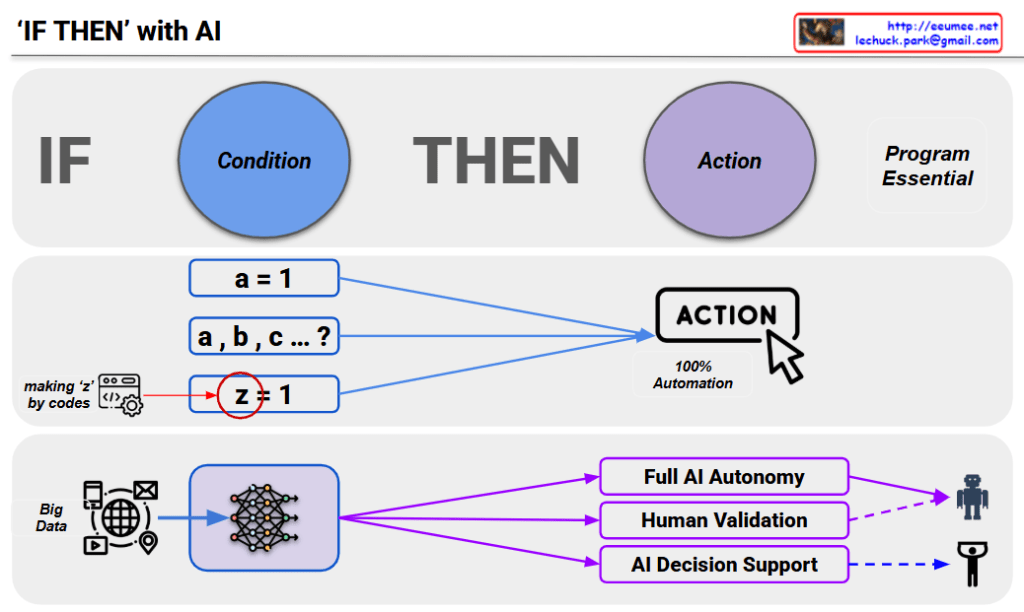
This image is a diagram titled “IF-THEN with AI” that explains conditional logic and automation levels in AI systems.

Top Section: Basic IF-THEN Structure

  • IF (Condition): Conditional part shown in blue circle
  • THEN (Action): Execution part shown in purple circle
  • Marked as “Program Essential,” emphasizing it as a core programming element

Middle Section: Evolution of Conditional Complexity

AI is ultimately a program, and like humans who wanted to predict by sensing data, making judgments, and taking actions based on those criteria. IF-THEN is essentially prediction – the foundation of programming that involves recognizing situations, making judgments, and taking actions.

Evolution stages of data/formulas:

  • a = 1: Simple value
  • a, b, c … ?: Processing multiple complex values simultaneously
  • Z ≠ 1: A condition that finds the z value through code on the left and compares it to 1 (highlighted with red circle, with annotation “making ‘z’ by codes”)

Now we input massive amounts of data and analyze with AI, though it has somewhat probabilistic characteristics.

Bottom Section: Evolution of AI Decision-Making Levels

Starting from Big Data through AI networks, three development directions:

  1. Full AI Autonomy: Complete automation that evolved to “Fine, just let AI handle it”
  2. Human Validation: Stage where humans evaluate AI judgments and incorporate them into operations
  3. AI Decision Support: Approach where humans initially handle the THEN action

Key Perspective: While these three development directions exist, there’s a need for judgment regarding decisions based on the quality of data used in analysis/judgment. This diagram shows that it’s not just about automation levels, but that data quality-based reliability assessment is a crucial consideration.

Summary

This diagram illustrates the evolution from simple conditional programming to complex AI systems, emphasizing that AI fundamentally operates on IF-THEN logic for prediction and decision-making. The key insight is that regardless of automation level, the quality of input data remains critical for reliable AI decision-making processes.

With Claude

per Watt with AI

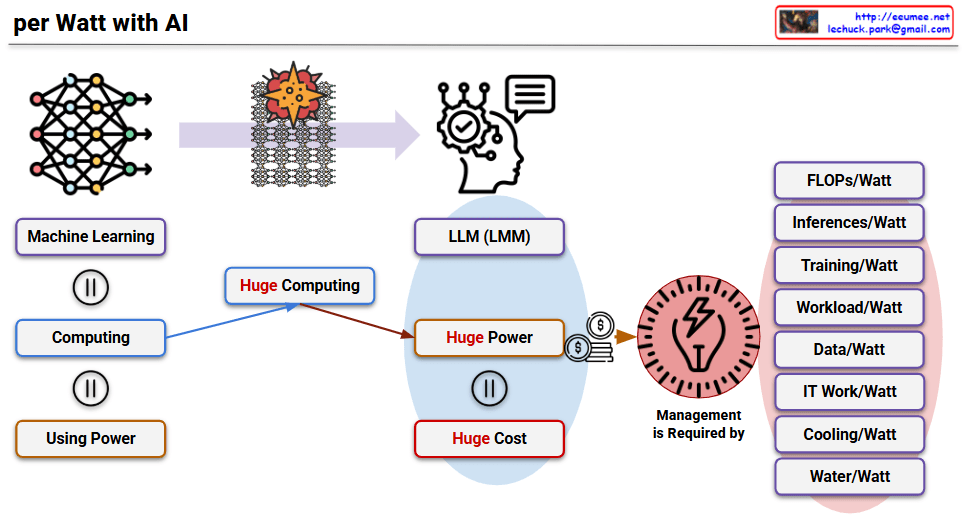
This image titled “per Watt with AI” is a diagram explaining the paradigm shift in power efficiency following the AI era, particularly after the emergence of LLMs.

Overall Context

Core Structure of AI Development:

  • Machine Learning = Computing = Using Power
  • The equal signs (=) indicate that these three elements are essentially the same concept. In other words, AI machine learning inherently means large-scale computing, which inevitably involves power consumption.

Characteristics of LLMs: As AI, particularly LLMs, have proven their effectiveness, tremendous progress has been made. However, due to their technical characteristics, they have the following structure:

  • Huge Computing: Massively parallel processing of simple tasks
  • Huge Power: Enormous power consumption due to this parallel processing
  • Huge Cost: Power costs and infrastructure expenses

Importance of Power Efficiency Metrics

With hardware advancements making this approach practically effective, power consumption has become a critical issue affecting even the global ecosystem. Therefore, power is now used as a performance indicator for all operations.

Key Power Efficiency Metrics

Performance-related:

  • FLOPs/Watt: Floating-point operations per watt
  • Inferences/Watt: Number of inferences processed per watt
  • Training/Watt: Training performance per watt

Operations-related:

  • Workload/Watt: Workload processing capacity per watt
  • Data/Watt: Data processing capacity per watt
  • IT Work/Watt: IT work processing capacity per watt

Infrastructure-related:

  • Cooling/Watt: Cooling efficiency per watt
  • Water/Watt: Water usage efficiency per watt

This diagram illustrates that in the AI era, power efficiency has become the core criterion for all performance evaluations, transcending simple technical metrics to encompass environmental, economic, and social perspectives.

With Claude

Learning , Reasoning, Inference

This image illustrates the three core processes of AI LLMs by drawing parallels to human learning and cognitive processes.

Learning

  • Depicted as a wise elderly scholar reading books in a library
  • Represents the lifelong process of absorbing knowledge and experiences accumulated by humanity over generations
  • The bottom icons show data accumulation and knowledge storage processes
  • Meaning: Just as AI learns human language and knowledge through vast text data, humans also build knowledge throughout their lives through continuous learning and experience

Reasoning

  • Shows a character deep in thought, surrounded by mathematical formulas
  • Represents the complex mental process of confronting a problem and searching for solutions through internal contemplation
  • The bottom icons symbolize problem analysis and processing stages
  • Meaning: The human cognitive process of using learned knowledge to engage in logical thinking and analysis to solve problems

Inference

  • Features a character confidently exclaiming “THE ANSWER IS CLEAR!”
  • Expresses the confidence and decisiveness when finally finding an answer after complex thought processes
  • The bottom checkmark signifies reaching a final conclusion
  • Meaning: The human act of ultimately speaking an answer or making a behavioral decision through thought and analysis

These three stages visually demonstrate how AI processes information in a manner similar to the natural human sequence of learning → thinking → conclusion, connecting AI’s technical processes to familiar human cognitive patterns.

With Claude

TCS (Technology Cooling Loop)

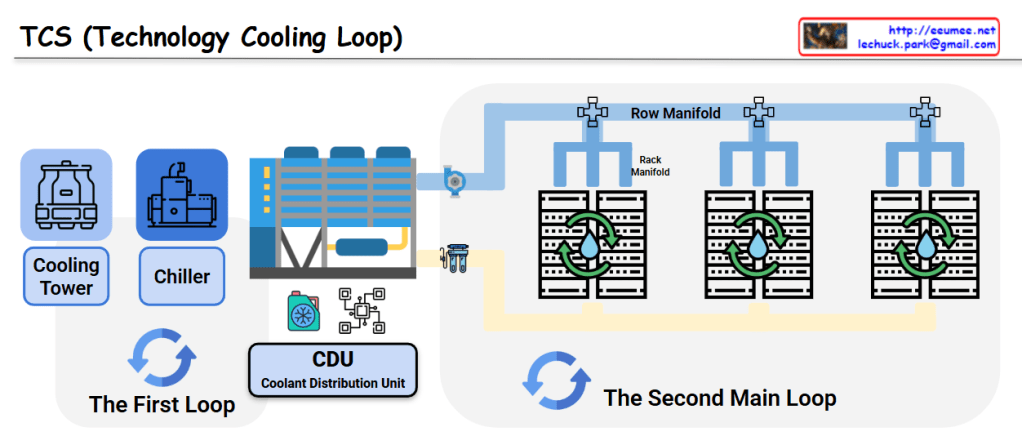
This image shows a diagram of the TCS (Technology Cooling Loop) system structure.

System Components

The First Loop:

  • Cooling Tower: Dissipates heat to the atmosphere
  • Chiller: Generates chilled water
  • CDU (Coolant Distribution Unit): Distributes coolant throughout the system

The Second Main Loop:

  • Row Manifold: Distributes cooling water to each server rack row
  • Rack Manifold: Individual rack-level cooling water distribution system
  • Server Racks: IT equipment racks that require cooling

System Operation

  1. Primary Loop: The cooling tower releases heat to the outside air, while the chiller produces chilled water that is supplied to the CDU
  2. Secondary Loop: Coolant distributed from the CDU flows through the Row Manifold to each server rack’s Rack Manifold, cooling the servers
  3. Circulation System: The heated coolant returns to the CDU where it is re-cooled through the primary loop

This is an efficient cooling system used in data centers and large-scale IT facilities. It systematically removes heat generated by server equipment to ensure stable operations through a two-loop architecture that separates the heat rejection process from the precision cooling delivery to IT equipment.

With Claude

1210th day

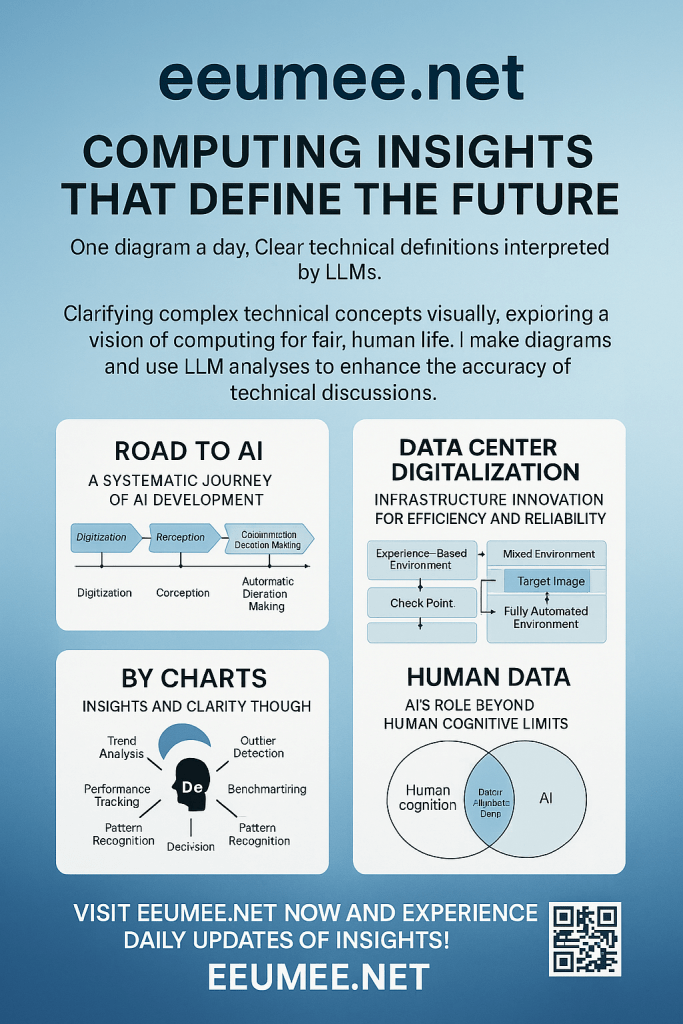
Eeumee.net: Your Daily Dose of Tech Clarity!

Tired of complex tech concepts feeling like a tangled mess? At Eeumee.net, we simplify the intricate world of technology into easy-to-digest, one-page diagrams, delivered daily!

What makes eeumee.net unique?

  • Visual Learning, Daily: We create a new, concise diagram (like a PPT page) every single day, breaking down essential technical elements into clear, visual summaries.
  • AI-Powered Precision: Each diagram is then interpreted and refined using advanced Large Language Models (LLMs). This process ensures that the definitions and explanations are accurate, well-structured, and easy to understand.
  • Master Your Concepts: Our primary goal is to help you (and us!) easily organize and solidify important technical knowledge in your mind. We believe that a clear definition is crucial for effective communication and accurate understanding in any technical discussion.
  • Enhance Technical Discussions: By providing precise and visually intuitive definitions, Eeumee.net serves as a vital resource for ensuring everyone is on the same page during technical conversations. It’s about fostering shared understanding and clarity.

Why visit eeumee.net?

Whether you’re a seasoned professional looking to quickly refresh a concept, a student trying to grasp new ideas, or simply someone who appreciates clear and concise explanations, Eeumee.net is your go-to resource. Stop struggling with vague definitions and start building a solid foundation of technical understanding, one diagram at a time.

Visit us today and bring clarity to your technical world!

Imaged by ChatGPT, Promotion text by Gemini