Multi-DCs Operation with a LLM (2)

This diagram illustrates a Multi-Data Center Operation with LLM architecture system configuration.

Overall Architecture Components

Left Side – Event Sources:

  • Various systems supporting different event protocols (Log, Syslog, Trap, etc.) generating events

Middle – 3-Stage Processing Pipeline:

  1. Collector – Light Blue
    • Composed of Local Integrator and Integration Deliver
    • Collects and performs initial processing of all event messages
  2. Integrator – Dark Blue
    • Stores/manages event messages in databases and log files
    • Handles data integration and normalization
  3. Analyst – Purple
    • Utilizes LLM and AI for event analysis
    • Generates event/periodic or immediate analysis messages

Core Efficiency of LLM Operations Integration (Bottom 4 Features)

  • Already Installed: Leverages pre-analyzed logical results from existing alert/event systems, enabling immediate deployment without additional infrastructure
  • Highly Reliable: Alert messages are highly deterministic data that significantly reduce LLM error possibilities and ensure stable analysis results
  • Easy Integration: Uses pre-structured alert messages, allowing simple integration with various systems without complex data preprocessing
  • Nice LLM: Operates reliably based on verified alert data and provides an optimal strategy for rapidly applying advanced LLM technology

Summary

This architecture enables rapid deployment of advanced LLM technology by leveraging existing alert infrastructure as high-quality, deterministic input data. The approach minimizes AI-related risks while maximizing operational intelligence, offering immediate deployment with proven reliability.

With Claude

Power Circuit Breaker

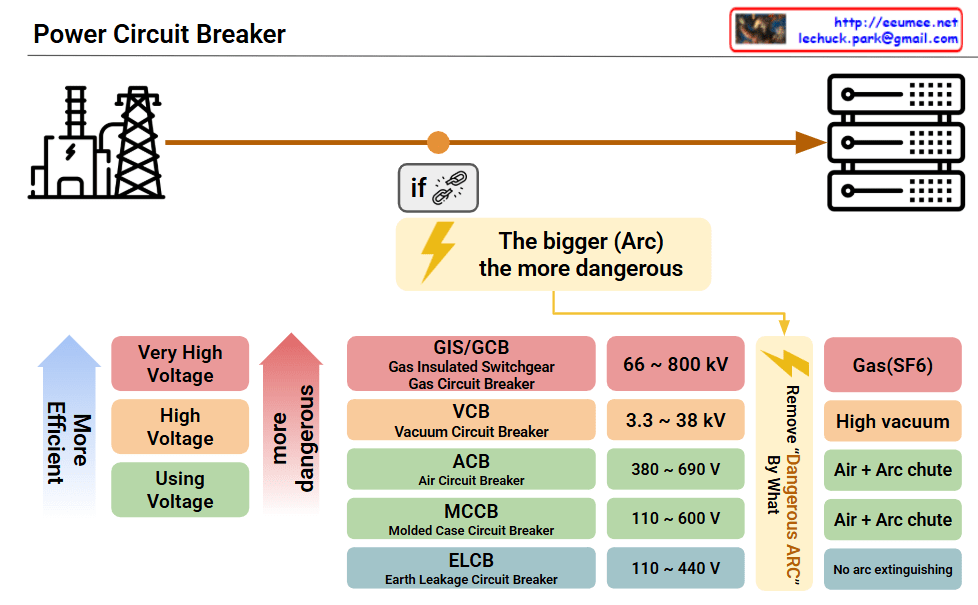
This image presents a Power Circuit Breaker classification diagram showing the types and characteristics of electrical circuit breakers used in power systems.

System Overview

Power Flow: The diagram illustrates the electrical power path from power plant → transmission lines → circuit breakers → distribution panels.

Circuit Breaker Classification

The breakers are categorized by voltage levels and arc extinguishing methods:

Voltage Classifications

  • Very High Voltage: 66~800kV
  • High Voltage: 3.3~38kV
  • Using Voltage: 380~690V, 110~600V, 110~440V

Breaker Types and Arc Extinguishing Methods

  1. GIS/GCB (Gas Insulated Switchgear/Gas Circuit Breaker)
    • 66~800kV
    • Uses SF6 gas with high vacuum technology
  2. VCB (Vacuum Circuit Breaker)
    • 3.3~38kV
    • Vacuum arc extinguishing method
  3. ACB (Air Circuit Breaker)
    • 380~690V
    • Air + arc chute method
  4. MCCB (Molded Case Circuit Breaker)
    • 110~600V
    • Air + arc chute method
  5. ELCB (Earth Leakage Circuit Breaker)
    • 110~440V
    • Ground fault protection, no arc extinguishing

Key Safety Message

The diagram emphasizes “The bigger (Arc) the more dangerous” – highlighting that higher voltages require more sophisticated and safer arc extinguishing technologies.

Summary: This technical diagram systematically categorizes power circuit breakers from ultra-high voltage (800kV) to low voltage (110V) applications, demonstrating how arc extinguishing complexity increases with voltage levels. The chart serves as an educational reference showing that higher voltage systems require more advanced safety mechanisms like SF6 gas insulation, while lower voltage applications can use simpler air-based arc interruption methods.

With Claude

Why/When Optimization ??

Analysis of Optimization Strategy Framework

Upper Graph: Stable Requirements Environment

  • Characteristics: Predictable requirements with minimal fluctuation
  • 100% Optimization Results:
    • “Very Difficult” (high implementation cost)
    • “No Efficiency” (poor ROI)
  • Conclusion: Over-optimization is unnecessary in stable environments

Lower Graph: Volatile Requirements Environment

  • Characteristics: Frequent requirement changes with high uncertainty
  • Optimization Level Analysis:
    • Peak Support (Blue): Reactive approach handling only maximum loads
    • 60-80% Optimization (Green): “Easy & High Efficiency”
    • 100% Optimization (Red): “Very Difficult” + “Still No Efficiency”

Key Insights

1. 60-80% Optimization as the Sweet Spot

  • Easy to achieve with reasonable effort
  • High efficiency in terms of cost-benefit ratio
  • Realistic and practical range for most business contexts

2. Environment-Specific Optimization Strategy

Stable Environment → Minimal optimization sufficient
Volatile Environment → 60-80% optimization optimal

3. The 100% Optimization Trap

  • Universally inefficient across all environments
  • Very difficult to achieve with no efficiency gains
  • Classic example of over-engineering

Practical Application Guide

60% Level: Minimum Professional Standard

  • MVP releases
  • Time-constrained projects
  • Experimental features

70% Level: General Target

  • Standard business products
  • Most commercial services
  • Typical quality benchmarks

80% Level: High-Quality Standard

  • Core business functions
  • Customer-facing critical services
  • Brand-value related elements

Business Implementation Framework

For Stable Environments:

  • Focus on basic functionality
  • Avoid premature optimization
  • Maintain simplicity

For Volatile Environments:

  • Target 60-80% optimization range
  • Prioritize adaptability over perfection
  • Implement iterative improvements

Conclusion: Philosophy of Practical Optimization

This framework demonstrates that “good enough” often outperforms “perfect” in real-world scenarios. The 60-80% optimization zone represents the intersection of achievability, efficiency, and business value—particularly crucial in today’s rapidly changing business landscape. True optimization isn’t about reaching 100%; it’s about finding the right balance between effort invested and value delivered, while maintaining the agility to adapt when requirements inevitably change.
(!) 60-80% is just a number. The best number is changed by …

With Claude

Multi-DCs Operation with a LLM (1)

This diagram illustrates a Multi-Data Center Operations Architecture leveraging LLM (Large Language Model) with Event Messages.

Key Components

1. Data Collection Layer (Left Side)

  • Collects data from various sources through multiple event protocols (Log, Syslog, Trap, etc.)
  • Gathers event data from diverse servers and network equipment

2. Event Message Processing (Center)

  • Collector: Comprises Local Integrator and Integration Deliver to process event messages
  • Integrator: Manages and consolidates event messages in a multi-database environment
  • Analyst: Utilizes AI/LLM to analyze collected event messages

3. Multi-Location Support

  • Other Location #1 and #2 maintain identical structures for event data collection and processing
  • All location data is consolidated for centralized analysis

4. AI-Powered Analysis (Right Side)

  • LLM: Intelligently analyzes all collected event messages
  • Event/Periodic or Prompted Analysis Messages: Generates automated alerts and reports based on analysis results

System Characteristics

This architecture represents a modern IT operations management solution that monitors and manages multi-data center environments using event messages. The system leverages LLM technology to intelligently analyze large volumes of log and event data, providing operational insights for enhanced data center management.

The key advantage is the unified approach to handling diverse event streams across multiple locations while utilizing AI capabilities for intelligent pattern recognition and automated response generation.

With Claude

Data Center ?

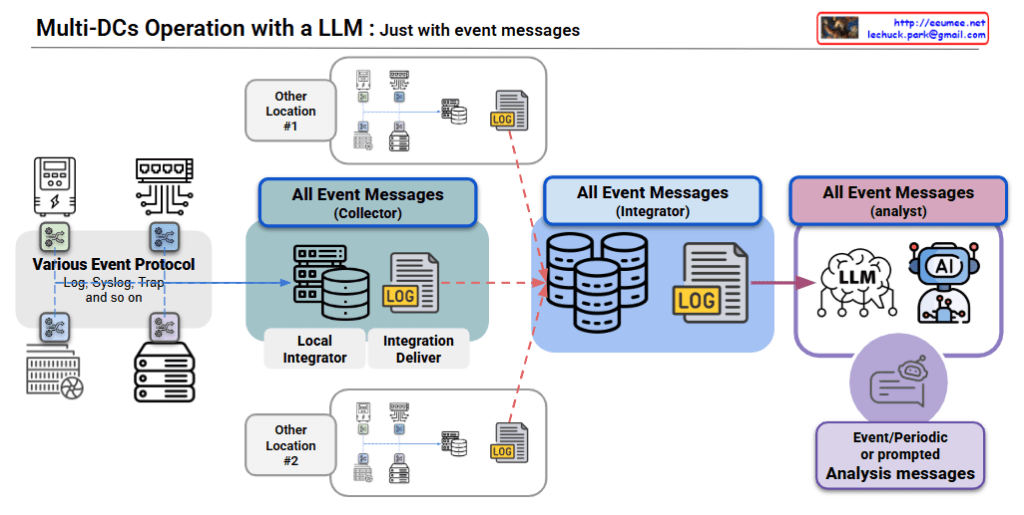
This infographic compares the evolution from servers to data centers, showing the progression of IT infrastructure complexity and operational requirements.

Left – Server

  • Shows individual hardware components: CPU, motherboard, power supply, cooling fans
  • Labeled “No Human Operation,” indicating basic automated functionality

Center – Modular DC

  • Represented by red cubes showing modular architecture
  • Emphasizes “More Bigger” scale and “modular” design
  • Represents an intermediate stage between single servers and full data centers

Right – Data Center

  • Displays multiple server racks and various infrastructure components (networking, power, cooling systems)
  • Marked as “Human & System Operation,” suggesting more complex management requirements

Additional Perspective on Automation Evolution:

While the image shows data centers requiring human intervention, the actual industry trend points toward increasing automation:

  1. Advanced Automation: Large-scale data centers increasingly use AI-driven management systems, automated cooling controls, and predictive maintenance to minimize human intervention.
  2. Lights-Out Operations Goal: Hyperscale data centers from companies like Google, Amazon, and Microsoft ultimately aim for complete automated operations with minimal human presence.
  3. Paradoxical Development: As scale increases, complexity initially requires more human involvement, but advanced automation eventually enables a return toward unmanned operations.

Summary: This diagram illustrates the current transition from simple automated servers to complex data centers requiring human oversight, but the ultimate industry goal is achieving fully automated “lights-out” data center operations. The evolution shows increasing complexity followed by sophisticated automation that eventually reduces the need for human intervention.

With Claude

HOPE OF THE NEXT

Hope to jump

This image visualizes humanity’s endless desire for ‘difference’ as the creative force behind ‘newness.’ The organic human brain fuses with the logical AI circuitry, and from their core, a burst of light emerges. This light symbolizes not just the expansion of knowledge, but the very moment of creation, transforming into unknown worlds and novel concepts.