Data Center Service Types

From the Bard with some prompting

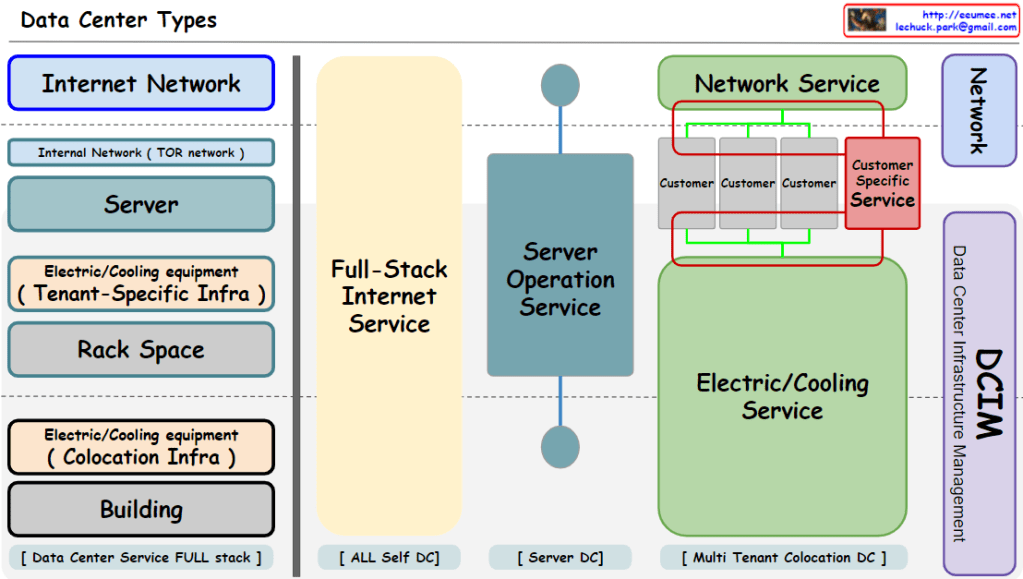
Data Center Types Diagram

This diagram shows four main types of data centers:

  • Full-stack data centers provide a comprehensive solution for all of a customer’s IT infrastructure. This includes servers, networks, storage, security, and operational services.
  • In-house data centers are owned and managed by the customer. This includes servers, networks, storage, security, and operational services.
  • Server data centers provide only servers. This includes servers, networks, and operational services.
  • Multi-tenant colocation data centers are shared by multiple customers. This includes servers, networks, and operational services.

This diagram shows the various factors that should be considered when selecting a data center. It is important to choose the type that is best suited to the customer’s needs and budget.

Digtalization

From the Bard with some prompting

The digitalization process is the process of converting analog information into digital form. This can be done for a variety of purposes, such as storing data, processing information, or transmitting data.

Digitalization process diagram

The digitalization process can be divided into five main steps:

  1. Data collection: This is the process of gathering the data that needs to be digitized. Data can be collected from a variety of sources, such as paper documents, files, images, or videos.
  2. Data preprocessing: This is the process of cleaning and formatting the data so that it can be analyzed. This may include tasks such as converting data formats, removing duplicates, or filling in missing values.
  3. Data structuring: This is the process of organizing the data in a logical way. This may involve storing the data in a database, or organizing it into tables or tree structures.
  4. Data analysis: This is the process of extracting meaning from the data. This may involve tasks such as identifying patterns, developing predictive models, or making decisions.
  5. Data visualization: This is the process of presenting the data in a way that is easy to understand. This may involve using charts, graphs, or maps to visualize the data.

The digitalization process can be used in a variety of industries. For example, it is used in manufacturing to track production data, in finance to analyze financial transactions, in healthcare to store medical records, and in government to track public records.**


Digital = Energy

From DALL-E with some prompting
this image illustrates the concept that “Digital equals Energy.” The first row shows the transformation from ‘NULL’, which represents nothingness, into a signal through energy, and then into a digital ‘1’ for computing. The second row demonstrates that digital operations require energy by showing that adding ‘1’ and ‘1’ results in ‘2’, with each ‘1’ requiring a unit of energy and the process generating heat, indicating energy loss.

AI TO REAL

From DALL-E with some prompting

The image depicts the concept of applying AI to real-world applications. It presents a flow from the human experience to digital transformation, then to AI, and finally applying AI to real-world scenarios. Here’s a breakdown of the components:

  • Human: Represents the human experience which is the source of data.
  • Experience to Digital: Indicates the process of translating human experiences into digital data.
  • Digital: Refers to the digital representation of data, shown as binary code.
  • Standard/Platform: Suggests that data and processes are standardized on a platform, allowing for the creation of new services easily.
  • AI: Depicts artificial intelligence as a technology or tool.
  • Accelerator to Real: Refers to the application of AI as an accelerator, making processes more precise and scalable, and applying them to real-world scenarios.

The overarching theme is “AI to REAL,” indicating a transition from abstract or digital concepts to practical, tangible applications in the real world. AI is seen as an accelerator that can enhance and expedite the implementation of digital solutions into everyday experiences, grounded in a standardized platform for ease of development and deployment.

Jiffies

From DALL-E with some prompting

The image provides an explanation of how time updates are handled in computer systems. The key points include:

  • “Jiffies” refers to a global variable used by the kernel to keep track of time.
  • Time updates are performed at the hardware level through “timer interrupts,” which are initiated periodically by the system’s real-time clock.
  • The “HW_TIMER_INTERRUPT” increments the jiffies value by one, and this can be set to various frequencies such as 100, 250, or 1000 Hertz (HZ).
  • There is a question about whether there is a delay when using “datetime,” which is crucial as time updates need to be processed in real-time.
  • The jiffies value can be read using the read() function, and functions like sleep(), usleep(), msleep(), nsleep(), and nanosleep() utilize this jiffies value to pause the execution of a program for a certain amount of time.

The image visually represents the concept of how the operating system’s kernel manages time and how time-related functions use the system’s “jiffies” value.