AI Infrastructure Architect & Technical Visualizer "Complex Systems, Simplified. I translate massive AI infrastructure into visual intelligence." I love to learn computer tech and help people by the digital.
From DALL-E with some prompting This diagram explains the process of finding new business opportunities from the perspective of digital transformation. The first step, ‘Digitization,’ involves converting real-world information into digital data while ensuring data quality. The next step, ‘Digitalization,’ extends the use of digital data to enhance automated processes. By executing these two steps, new opportunities can be discovered, and through ‘Digital Transformation,’ these discoveries can be converted into actual innovations. Overall, this process presents a methodology for leveraging digital technology to innovate business models and create new value.
From DALL-E with some prompting This diagram illustrates the process by which an application process requests services from the operating system through a system call. Applications running in user space cannot directly access hardware resources and must go through the operating system located in kernel space to perform necessary operations. System calls act as an interface between user space and kernel space, which is crucial for the system’s stability and security. The operating system abstracts hardware resources, facilitating easy access for applications.
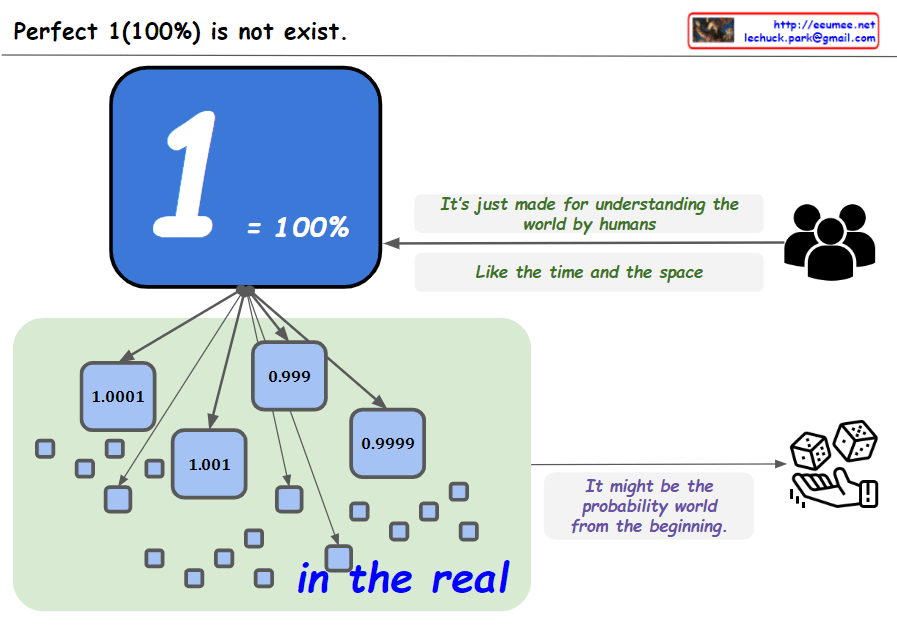
From the bard with some prompting The image you provided consists of 10 squares with numbers from 1 to 0.9999, along with the phrase “Perfect 1 (100%) does not exist.”
The image conveys the message that perfection is impossible. The 10 squares represent 100%, but it is impossible to reach 100%, no matter how close we get. The number 0.9999 in the last square shows that it is close to perfection, but ultimately not perfect.
The image can also convey the message that the real world is uncertain and unpredictable. There is nothing that we can be 100% sure of, and there is always some uncertainty.
Finally, the image can convey the message that we are always growing and learning. The numbers from 1 to 0.9999 show that we are always getting closer to perfection, but we are never perfect.
The image is an open image that can be interpreted in many ways. Each individual can interpret the image according to their own experiences and values.
Here are some specific interpretations of the image:
Perfection is impossible: No matter how hard we try, we will never be perfect. There will always be room for improvement. The real world is uncertain: There is always some risk or uncertainty in life. We cannot control everything that happens. We are always growing and learning: We are constantly learning and evolving. We can always strive to be better. Ultimately, the meaning of the image is up to the individual to decide.
From The Bard with some prompting The image is a diagram of how a traceroute works. Traceroute is a tool that uses ICMP packets to determine the path that a packet takes from a source to a destination.
The image shows the following steps:
The source sends an ICMP packet with a TTL (time to live) of 1. The first router that receives the packet decrements the TTL by 1 and sends it to the next router. If the TTL reaches 0 before reaching the destination, the router sends an ICMP packet back to the source with an error message. The source then sends an ICMP packet with a TTL of 2. The process repeats until the destination is reached. The text in the image provides additional information about each step. For example, the text for step 1 states that the source sends an ICMP packet with a TTL of 1. This means that the packet will be discarded by any router that receives it after it has traveled 1 hop.
The image also shows the following information:
The source IP address is 192.168.1.1.
The destination IP address is 203.0.113.5.
The RTT (round-trip time) for each hop is shown in milliseconds.
The image is a useful tool for understanding how traceroute works. It can be used to troubleshoot network problems by identifying the routers that are causing delays or errors.
Here is a more concise summary of the image:
Traceroute uses ICMP packets to determine the path that a packet takes from a source to a destination. The source sends an ICMP packet with a TTL of 1. If the TTL reaches 0 before reaching the destination, the router sends an ICMP packet back to the source with an error message. The source then sends an ICMP packet with a TTL of 2. The process repeats until the destination is reached.tunesharemore_vertadd_photo_alternate
From DALL-E with some prompting This image appears to be a diagram explaining the concepts of scalar, vector, matrix, and tensor in the context of dimensions and data structures:
Scalar: Represented as a zero-dimensional entity and is simply a single value that exists. Vector: Shown as one-dimensional, it is depicted as an arrow, indicating a feature or a point with direction and magnitude. Matrix: Illustrated as two-dimensional, like a grid, representing connected data points. Tensor: Described with ‘N dimension’, suggesting a complex structure where all elements are interconnected, like a network of points extending beyond two dimensions. This progression shows how data structures become more complex and capable of representing more intricate relationships as the number of dimensions increases.
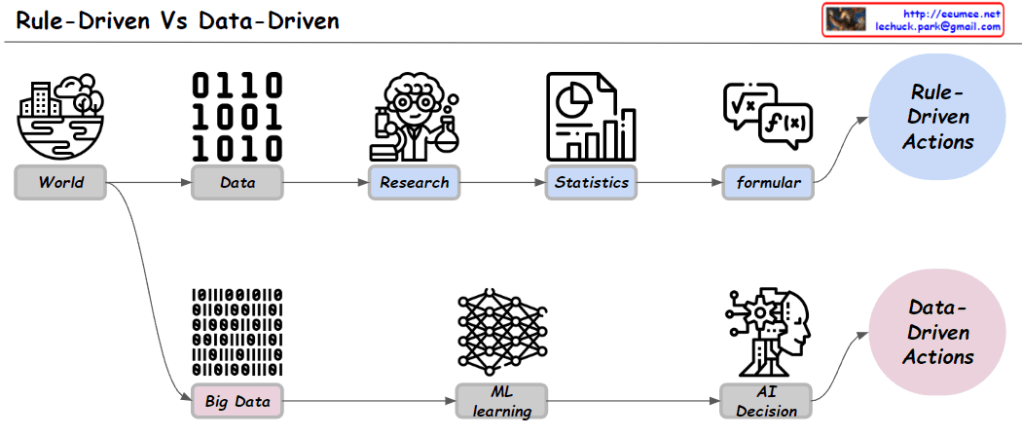
Rule-based and data-driven systems are two different approaches to artificial intelligence (AI).
Data-driven systems make decisions based on data. For example, a data-driven system could be used to recommend products to customers based on their purchase history.
Here is a summary of the key differences between rule-based and data-driven systems:
Decision-making process: Rule-based systems use if-then rules, while data-driven systems use data.
Examples: Rule-based systems can be used for simple tasks, such as turning on a fan. Data-driven systems can be used for more complex tasks, such as recommending products to customers.
Strengths: Rule-based systems are simple and easy to understand. Data-driven systems are accurate.
Weaknesses: Rule-based systems can be difficult to adapt to new situations. Data-driven systems can be inaccurate if data is insufficient.
In conclusion, rule-based systems are simple and easy to understand, but they can be difficult to adapt to new situations. Data-driven systems are accurate, but they can be inaccurate if data is insufficient.