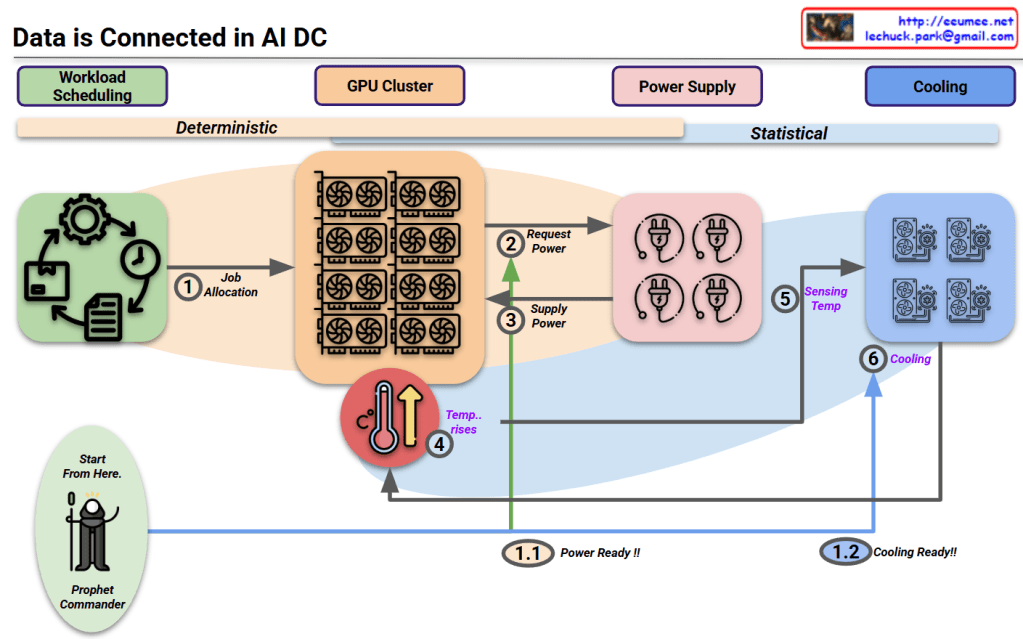
This diagram titled “Data is Connected in AI DC” illustrates the relationships starting from workload scheduling in an AI data center.
Key aspects of the diagram:
- The entire system’s interconnected relationships begin with workload scheduling.
- The diagram divides the process into two major phases:
- Deterministic phase: Primarily concerned with power requirements that operate in a predictable, planned manner.
- Statistical phase: Focused on cooling requirements, where predictions vary based on external environmental conditions.
- The “Prophet Commander” at the workload scheduling stage can predict/direct future requirements, allowing the system to prepare power (1.1 Power Ready!!) and cooling (1.2 Cooling Ready!!) in advance.
- Process flow:
- Job allocation from workload scheduling to GPU cluster
- GPUs request and receive power
- Temperature rises due to operations
- Cooling system detects temperature and activates cooling
This diagram illustrates the interconnected workflow in AI data centers, beginning with workload scheduling that enables predictive resource management. The process flows from deterministic power requirements to statistical cooling needs, with the “Prophet Commander” enabling proactive preparation of power and cooling resources. This integrated approach demonstrates how workload prediction can drive efficient resource allocation throughout the entire AI data center ecosystem.
With Claude