Traffic Control

This image shows a network traffic control system architecture. Here’s a detailed breakdown:

  1. At the top, several key technologies are listed:
  • P4 (Programming Protocol-Independent Packet Processors)
  • eBPF (Extended Berkeley Packet Filter)
  • SDN (Software-Defined Networking)
  • DPI (Deep Packet Inspection)
  • NetFlow/sFlow/IPFIX
  • AI/ML-Based Traffic Analysis
  1. The system architecture is divided into main sections:
  • Traffic flow through IN PORT and OUT PORT
  • Routing based on Destination IP address
  • Inside TCP/IP and over TCP/IP sections
  • Security-Related Conditions
  • Analysis
  • AI/ML-Based Traffic Analysis
  1. Detailed features:
  • Inside TCP/IP: TCP/UDP Flags, IP TOS (Type of Service), VLAN Tags, MPLS Labels
  • Over TCP/IP: HTTP/HTTPS Headers, DNS Queries, TLS/SSL Information, API Endpoints
  • Security-Related: Malicious Traffic Patterns, Encryption Status
  • Analysis: Time-Based Conditions, Traffic Patterns, Network State Information
  1. The AI/ML-Based Traffic Analysis section shows:
  • AI/ML technologies learn traffic patterns
  • Detection of anomalies
  • Traffic control based on specific conditions

This diagram represents a comprehensive approach to modern network monitoring and control, integrating traditional networking technologies with advanced AI/ML capabilities. The system shows a complete flow from packet ingress to analysis, incorporating various layers of inspection and control mechanisms.

with Claude

Data Center Supply

With Claude
The supply system in data centers follows a unified control flow pattern of “Change → Distribute → Block”. This pattern is consistently applied across all core infrastructure elements (Traffic, Power, and Cooling). Let’s examine each stage and its applications:

1. Change Stage

  • Transforms incoming resources into forms suitable for the system
  • Traffic: Protocol/bandwidth conversion through routers
  • Power: Voltage/current conversion through transformers/UPS
  • Cooling: Temperature conversion through chillers/heat exchangers

2. Distribute Stage

  • Efficiently distributes converted resources where needed
  • Traffic: Network load distribution through switches and load balancers
  • Power: Power distribution through distribution boards and bus ducts
  • Cooling: Cooling air/water distribution through ducts/piping/dampers

3. Block Stage

  • Ensures system protection and security
  • Traffic: Security threat prevention through firewalls/IPS/IDS
  • Power: Overload protection through circuit breakers and fuses
  • Cooling: Backflow prevention through shutoff valves and dampers

Benefits of this unified approach:

  1. Ensures consistency in system design
  2. Increases operational management efficiency
  3. Enables quick problem identification
  4. Improves scalability and maintenance

Detailed breakdown by domain:

Traffic Management

  • Change: Router gateways (Protocol/Bandwidth)
  • Distribute: Switch/L2/L3, Load Balancer
  • Block: Firewall, IPS/IDS, ACL Switch

Power Management

  • Change: Transformer, UPS (Voltage/Current/AC-DC)
  • Distribute: Distribution boards/bus ducts
  • Block: Circuit breakers (MCCB/ACB), ELB, Fuses

Cooling Management

  • Change: Chillers/Heat exchangers (Water→Air)
  • Distribute: Ducts/Piping/Dampers
  • Block: Backflow prevention/isolation/fire dampers, shutoff valves

This structure enables systematic and efficient operation of complex data center infrastructure by managing the three critical supply elements (Traffic, Power, Cooling) within the same framework. Each component plays a specific role in ensuring the reliable and secure operation of the data center, while maintaining consistency across different systems.

DC Key metrics for operating

From Claude with some prompting
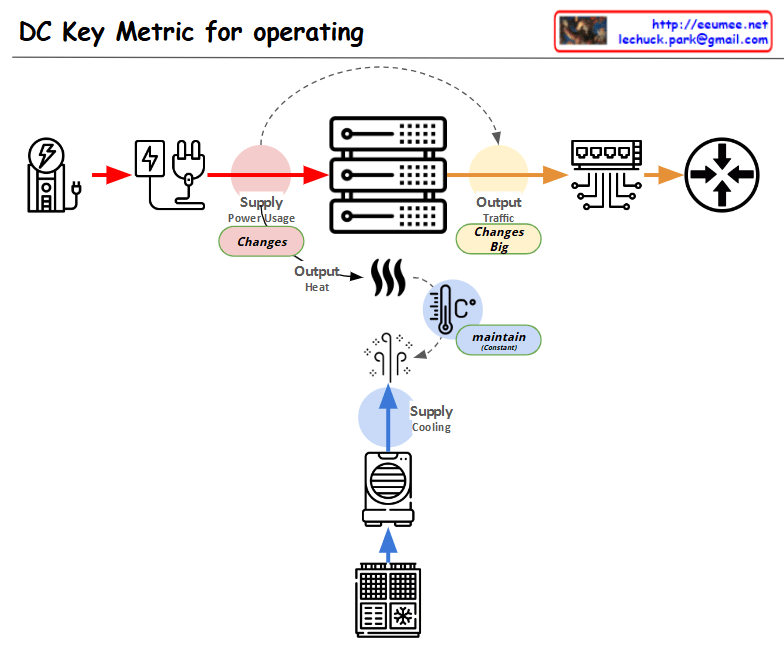
This diagram showing the key metrics for Data Center (DC) operations:

  1. Power Supply Chain:
  • Power input → Power conversion/distribution → Server equipment
  • Marked as “Supply Power Usage” with a note indicating “Changes” in variability
  1. Server Operations:
  • Server racks shown in the center
  • Two main outputs:
    • Top: “Output Traffic” with a note “Changes Big” indicating high variability
    • Bottom: “Output Heat” generation
  1. Cooling System:
  • Cooling equipment shown at the bottom
  • Marked as “Supply Cooling”
  • Temperature icon with “maintain” indicator showing the need to maintain consistent temperature
  1. Overall Flow:
  • Power input → Server operations → Network output
  • Separate cooling circulation system for heat management

The diagram illustrates the interconnection between three critical elements of data center operations:

  • Power supply management
  • Server operations
  • Cooling system

Each component shows potential variability points (marked as “Changes”) and management requirements, with special attention to:

  • Power usage monitoring
  • Traffic output management
  • Heat dissipation and temperature control

This visualization effectively demonstrates how these systems work together in a data center environment, highlighting the key areas that require monitoring and management for optimal operation.

Changes of the network traffic

From Claude with some prompting
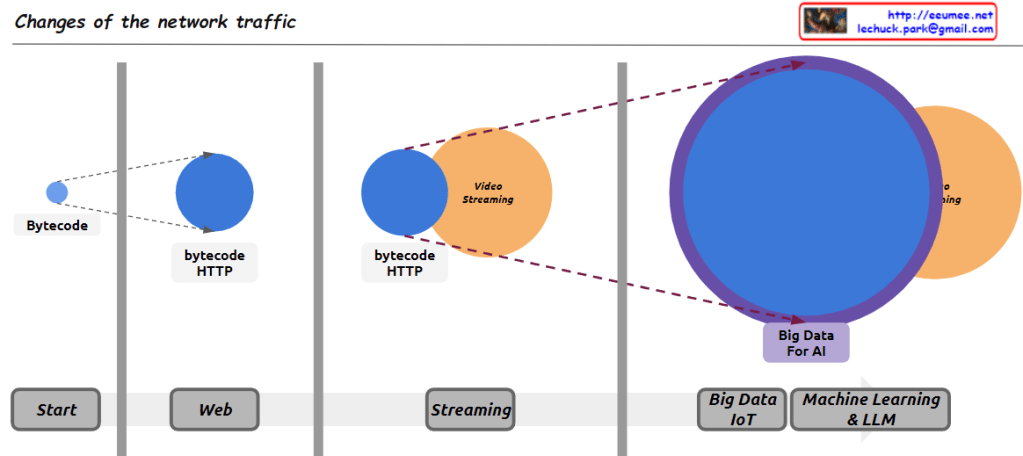
Here’s an interpretation of the diagram in English, focusing on the major changes in internet traffic types:

  1. Early Internet (Start): The small “Bytecode” circle represents the limited data exchange of the early internet. This period was primarily characterized by simple, text-based information exchange.
  2. Web Era (Web): The larger “bytecode HTTP” circle illustrates the surge in HTTP traffic with the advent of the World Wide Web. This represents increased traffic from web browsing, email, and early online services.
  3. Streaming Age (Streaming): The addition of the “Video Streaming” circle signifies the explosive growth in video streaming traffic, driven by platforms like YouTube and Netflix. This marks a paradigm shift in internet bandwidth usage.
  4. Big Data and AI Era (Big Data IoT / Machine Learning & LLM): The largest circle, “Big Data For AI,” represents the enormous traffic increase due to IoT device proliferation, cloud computing ubiquity, and large-scale data processing for AI and machine learning. This suggests it now constitutes the largest portion of internet traffic.

This diagram effectively shows the evolution of internet traffic from simple data exchange to web-based services, media streaming, and the current data-centric, AI-driven era.

Comments (points to be cautious about):

  1. Accuracy: It’s unclear if the circle sizes accurately reflect actual traffic volumes. This should be understood as a conceptual representation.
  2. Time scale: The time intervals between stages may not be uniform, which is not indicated in the diagram.
  3. Overlap: In reality, these traffic types coexist and are not as distinctly separated as the diagram suggests.
  4. Recent trends: The diagram doesn’t reflect traffic changes due to latest technological trends like 5G or edge computing.
  5. Regional differences: These changes may not have occurred uniformly worldwide, which is not reflected in the diagram.

It’s important to consider these points when interpreting the diagram. Overall, this image effectively conveys the macroscopic trends in the evolution of internet traffic in a concise and impactful manner.

For the Same Traffic metering

From Claude with some prompting
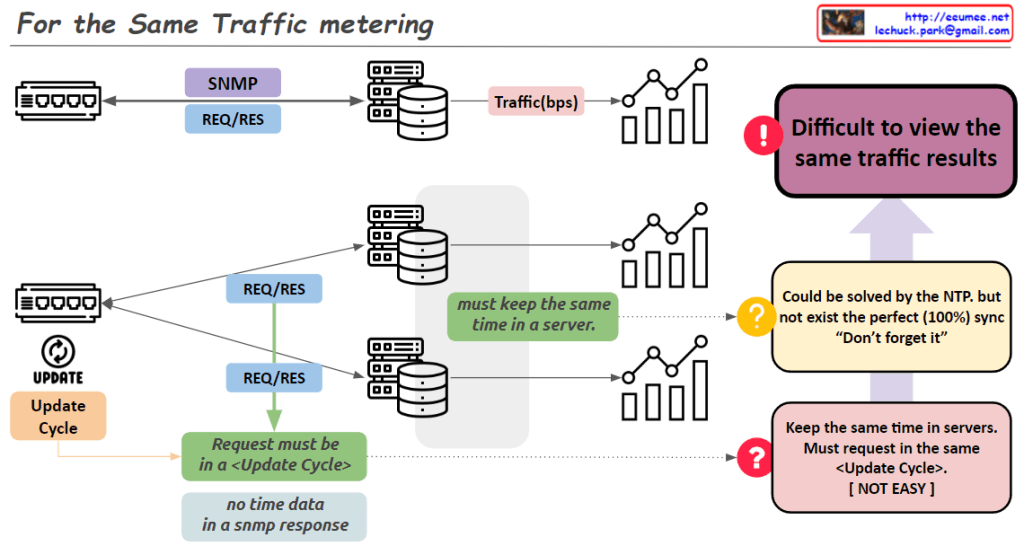
“For the Same Traffic Metering” – Key Points:

  1. Problem: Different collection servers using SNMP may not yield the same results for identical traffic.
  2. Main causes of discrepancy:
    • Network equipment updates traffic information periodically.
    • To get consistent values, SNMP requests must align with the equipment’s update cycle.
    • Difficult to synchronize requests precisely across multiple servers.
  3. Challenges for resolution:
    • Servers need accurate time synchronization.
    • All requests should occur within the same ‘Update Cycle’ of the equipment.
  4. Time synchronization:
    • NTP can partially solve the issue.
    • Perfect (100%) synchronization is not achievable in practice.
  5. Consequence: SNMP data collected from multiple servers may show different results for the same traffic.
  6. Key insight: The image emphasizes the difficulties in accurate data collection using SNMP in network monitoring systems.
  7. Implications: Network administrators and system designers must be aware of these limitations and consider them when collecting and interpreting data.

This summary highlights the complexities involved in ensuring consistent traffic metering across multiple collection points in a network environment.

Anomaly Traffic Detection#1

From DALL-E with some prompting
The flowchart illustrates a four-step network anomaly detection process:

  1. Data Collection: Gather various types of network data.
  2. Protocol Usage: Employ SNMP, SFLOW/NETFLOW, and other methods to extract the data.
  3. Analysis: Analyze Ethernet and TCP/IP header data for irregularities.
  4. Control: Implement countermeasures like blocking traffic or controlling specific IP addresses.

The expected benefits of this process include enhanced network security through early detection of anomalies, the ability to prevent potential breaches by blocking suspicious traffic, and improved network management via real-time analysis and control.