Time Series Data

From Claude with some prompting

  1. Raw Time Series Data:
    • Data Source: Sensors or meters operating 24/7, 365 days a year
    • Components: a. Point: The data point being measured b. Metric: The measurement value for each point c. Time: When the data was recorded
    • Format: (Point, Value, Time)
    • Additional Information: a. Config Data: Device name, location, and other setup information b. Tag Info: Additional metadata or classification information for the data
    • Characteristics:
      • Continuously updated based on status changes
      • Automatically changes over time
  2. Processed Time Series Data (2nd logical Data):
    • Processing Steps: a. ETL (Extract, Transform, Load) operations b. Analysis of correlations between data points (Point A and Point B) c. Data processing through f(x) function
      • Creating formulas through correlations using experience and AI learning
    • Result:
      • Generation of new data points
      • Includes original point, related metric, and time information
    • Characteristics:
      • Provides more meaningful and correlated information than raw data
      • Reflects relationships and influences between data points
      • Usable for more complex analysis and predictions

Through this process, Raw Time Series Data is transformed into more useful and insightful Processed Time Series Data. This aids in understanding data patterns and predicting future trends.
Operation with AI

From Claude with some prompting
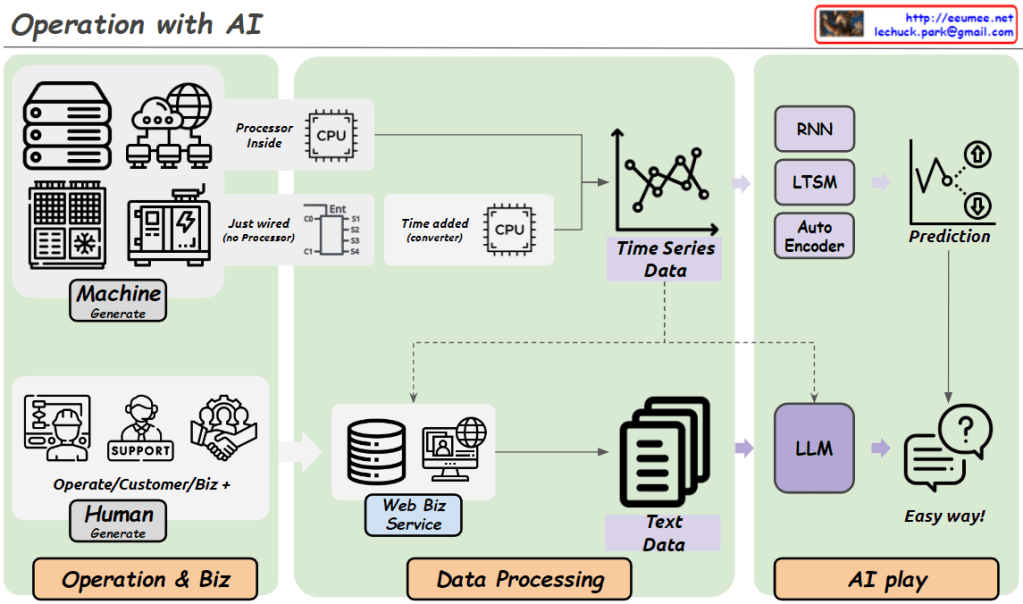
This diagram illustrates an integrated approach to modern operational management. The system is divided into three main components: data generation, data processing, and AI application.

The Operation & Biz section shows two primary data sources. First, there’s metric data automatically generated by machines such as servers and network equipment. Second, there’s textual data created by human operators and customer service representatives, primarily through web portals.

These collected data streams then move to the central Data Processing stage. Here, metric data is processed through CPUs and converted into time series data, while textual data is structured via web business services.

Finally, in the AI play stage, different AI models are applied based on data types. For time series data, models like RNN, LSTM, and Auto Encoder are used for predictive analytics. Textual data is processed through a Large Language Model (LLM) to extract insights.

This integrated system effectively utilizes data from various sources to improve operational efficiency, support data-driven decision-making, and enable advanced analysis and prediction through AI. Ultimately, it facilitates easy and effective management even in complex operational environments.

The image emphasizes how different types of data – machine-generated metrics and human-generated text – are processed and analyzed using appropriate AI techniques, all from the perspective of operational management.

TSDB flow for alerts

From Claude with some prompting
This image illustrates the flow and process of a Time Series Database (TSDB) system. The main components are:

Time Series Data: This is the input data stream containing time-stamped values from various sources or metrics.

Counting: It performs change detection on the incoming time series data to capture relevant events or anomalies.

Delta Value: The difference or change observed in the current value compared to a previous reference point, denoted as NOW() – previous value.

Time-series summary Value: Various summary statistics like MAX, MIN, and other aggregations are computed over the time window.

Threshold Checking: The delta values and other aggregations are evaluated against predefined thresholds for anomaly detection.

Alert: If any threshold conditions are violated, an alert is triggered to notify the monitoring system or personnel.

The process also considers correlations with other metrics for improved anomaly detection context. Additionally, AI-based techniques can derive new metrics from the existing data for enhanced monitoring capabilities.

In summary, this flow diagram represents the core functionality of a time series database focused on capturing, analyzing, and alerting on anomalies or deviations from expected patterns in real-time data streams.

Time Series Data in a DC

From Claude with some prompting
This image illustrates the concept of time series data analysis in a data center environment. It shows various infrastructure components like IT servers, networking, power and cooling systems, security systems, etc. that generate continuous data streams around the clock (24 hours, 365 days).

This time series data is then processed and analyzed using different machine learning and deep learning techniques such as autoregressive integrated moving average models, generalized autoregressive conditional heteroskedasticity, isolation forest algorithms, support vector machines, local outlier factor, long short-term memory models, and autoencoders.

The goal of this analysis is to gain insights, make predictions, and uncover patterns from the continuous data streams generated by the data center infrastructure components. The analysis results can be further utilized for applications like predictive maintenance, resource optimization, anomaly detection, and other operational efficiency improvements within the data center.

Event & Alarm

From DALL-E with some prompting

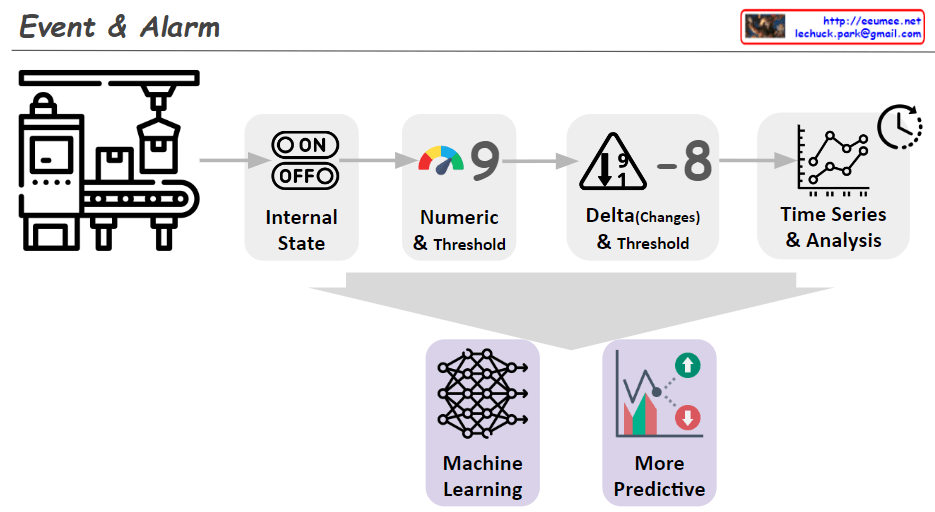
The image illustrates the progressive stages of detecting alarm events through data analysis. Here’s a summary:

  1. Internal State: It shows a machine with an ‘ON/OFF’ state, indicating whether the equipment is currently operating.
  2. Numeric & Threshold: A numeric value is monitored against a set threshold, which can trigger an alert if exceeded.
  3. Delta (Changes) & Threshold: A representation of an alert triggered by significant changes or deviations in the equipment’s performance, as compared to a predefined threshold.
  4. Time Series & Analysis: This suggests that analyzing time-series data can identify trends and forecast potential issues.
  5. Machine Learning: Depicts the use of machine learning to interpret data and build predictive models.
  6. More Predictive: The final stage shows the use of machine learning insights to anticipate future events, leading to a more sophisticated alarm system.

Overall, the image conveys the evolution of alarm systems from basic monitoring to advanced prediction using machine learning.