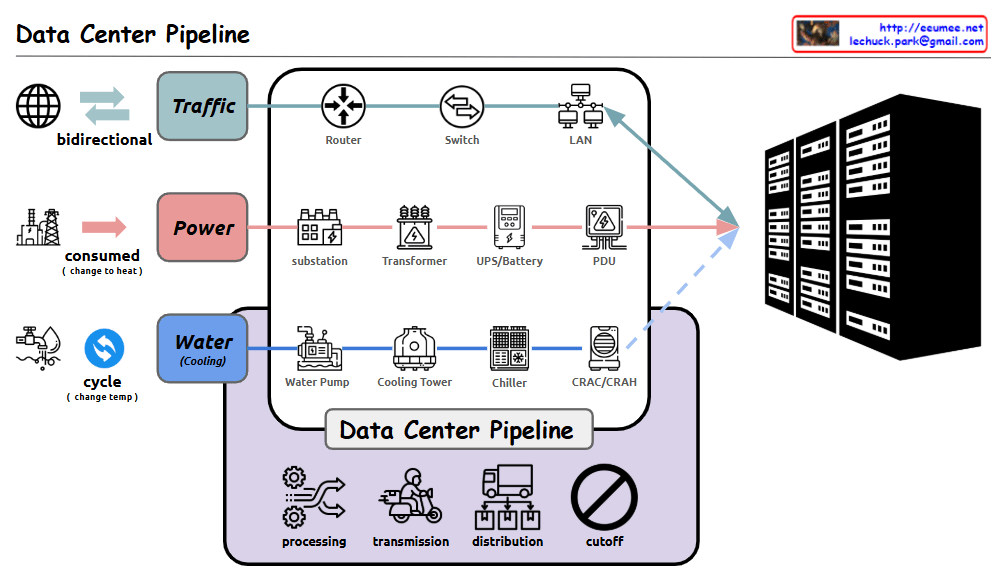
High Computing Room Requires

With a Claude’s Help
Core Challenge:

  1. High Variability in GPU/HPC Computing Room
  • Dramatic fluctuations in computing loads
  • Significant variations in power consumption
  • Changing cooling requirements

Solution Approach:

  1. Establishing New Data Collection Systems
  • High Resolution Data: More granular, time-based data collection
  • New Types of Data Acquisition
  • Identification of previously overlooked data points
  1. New Correlation Analysis
  • Understanding interactions between computing/power/cooling
  • Discovering hidden patterns among variables
  • Deriving predictable correlations

Objectives:

  • Managing variability through AI-based analysis
  • Enhancing system stability
  • Improving overall facility operational efficiency

In essence, the diagram emphasizes that to address the high variability challenges in GPU/HPC environments, the key strategy is to collect more precise and new types of data, which enables the discovery of new correlations, ultimately leading to improved stability and efficiency.

This approach specifically targets the inherent variability of GPU/HPC computing rooms by focusing on data collection and analysis as the primary means to achieve better operational outcomes.

Server room Connected Data

with a claude’s help
This diagram represents the key interconnected elements within a server room in a data center. It is composed of three main components:

  1. Server Load: This represents the computing processing demand on the server hardware.
  2. Cooling Load: This represents the cooling system’s load required to remove the heat generated by the server equipment.
  3. Power Load: This represents the electrical power demand needed to operate the server equipment.

These three elements are closely related. As the Server Load increases, the Power Load increases, which then leads to greater heat generation and an increase in Cooling Load.

Applying this to an actual data center environment, important considerations would include:

  1. Server rack placement: Efficient rack arrangement to optimize cooling performance and power distribution.
  2. Hot air exhaust channels: Dedicated pathways to effectively expel the hot air from the server racks, reducing Cooling Load.
  3. Cooling system capacity: Sufficient CRAC (Computer Room Air Conditioning) units to handle the Cooling Load.
  4. Power supply: Appropriate PDU (Power Distribution Unit) to provide the necessary Power Load for stable server operation.

By accounting for these real-world data center infrastructure elements, the diagram can be further enhanced to provide more practical and applicable insights.

Overall, this diagram effectively illustrates the core interdependent components within a server room and how they relate to the actual data center operational environment.Copy

PUE Details

With a Claude’s Help
This image provides detailed information on Power Usage Effectiveness (PUE), a key metric for measuring the energy efficiency of a data center.

The overall structure shows that power received from the High Power Receiver is distributed to various components, including IT equipment and cooling systems, through the Power Distributor.

To calculate PUE, several granular metrics are required, such as IT power, cooling power, and total power consumption. These detailed items are grouped into larger categories for easier management and standardization.

For example, IT power is further broken down into servers, storage, and network equipment. Cooling power includes CRAC units, cooling towers, and pump systems. The power supply stages are also differentiated to identify points of power loss.

Furthermore, detailed monitoring of individual IT and cooling equipment power consumption enables more accurate PUE calculation and optimization.

In summary, effective PUE management requires categorizing the total power usage into IT power, cooling power, and other power, and then further subdividing these groups into standardized, measurable components. Real-time monitoring and data analysis are crucial for continually improving energy efficiency in the data center.

DC Key metrics for operating

From Claude with some prompting
This diagram showing the key metrics for Data Center (DC) operations:

  1. Power Supply Chain:
  • Power input → Power conversion/distribution → Server equipment
  • Marked as “Supply Power Usage” with a note indicating “Changes” in variability
  1. Server Operations:
  • Server racks shown in the center
  • Two main outputs:
    • Top: “Output Traffic” with a note “Changes Big” indicating high variability
    • Bottom: “Output Heat” generation
  1. Cooling System:
  • Cooling equipment shown at the bottom
  • Marked as “Supply Cooling”
  • Temperature icon with “maintain” indicator showing the need to maintain consistent temperature
  1. Overall Flow:
  • Power input → Server operations → Network output
  • Separate cooling circulation system for heat management

The diagram illustrates the interconnection between three critical elements of data center operations:

  • Power supply management
  • Server operations
  • Cooling system

Each component shows potential variability points (marked as “Changes”) and management requirements, with special attention to:

  • Power usage monitoring
  • Traffic output management
  • Heat dissipation and temperature control

This visualization effectively demonstrates how these systems work together in a data center environment, highlighting the key areas that require monitoring and management for optimal operation.

SCADA & EPMS

From Perplexity with some prompting
The image illustrates the roles and coverage of SCADA and EPMS systems in power management for data centers.

SCADA System

  • Target: Power Suppliers and Large Power Consumers (Big Power Using DC)
  • Role:
    • Power Suppliers: Remotely monitor and control infrastructure like power plants and substations to ensure the stability of large-scale power grids.
    • Large Data Centers: Manage complex power infrastructure and ensure stable power supply by utilizing some SCADA functionalities.
  • Coverage: Large power management and remote control

EPMS System

  • Target: Small Data Centers (Small DC)
  • Role:
    • Monitor and manage power usage within the data center to optimize energy efficiency.
    • Perform detailed local control of power management.
  • Coverage: Power monitoring and local control

Key Distinctions

  • SCADA focuses on large-scale power management and remote control, suitable for power suppliers and large consumers.
  • EPMS is used primarily in small data centers for optimizing energy consumption through local control.

In conclusion, large data centers benefit from using both SCADA and EPMS to effectively manage complex power infrastructures, while small data centers typically rely on EPMS for efficient energy management.

Computing Power 4-Optimizations

From Claude with some prompting
The image “Computing Power 4-Optimizations” highlights four key areas for optimizing computing power, emphasizing a comprehensive approach that goes beyond infrastructure to include both hardware and software perspectives:

  1. Processing Optimizing: Focuses on hardware-level optimization, utilizing advanced manufacturing process technology to develop low-power GPUs and CPUs. It incorporates techniques like dynamic voltage and frequency scaling, and clock/power gating to maximize chip efficiency.
  2. Power Supply Optimizing: Addresses infrastructure-level optimization, improving power management and distribution across the entire system. This involves efficient power supply units and intelligent power management systems.
  3. Cooling Supply Optimizing: Another infrastructure-level optimization, enhancing thermal management of the system. Efficient cooling is crucial for maintaining computing performance while reducing power consumption.
  4. Code Optimizing: Emphasizes software-level optimization, including programming optimization, workload optimization at the OS level, and ‘green coding’ practices. This underscores the importance of considering energy efficiency in the software development process.

The diagram effectively illustrates that computing power optimization is not limited to hardware or infrastructure improvements alone. It stresses the need for a holistic approach, from chip design to code writing, to achieve effective optimization. By considering both hardware (chip) and software (code) level optimizations together, the overall system efficiency can be maximized. This comprehensive view is essential for addressing the complex challenges of power management in modern computing systems.

Server Room Stability & Optimization

From Claude with some prompting
Server Room Stability & Optimization

  1. Cooling Supply: Ensuring sufficient cooling capacity to effectively dissipate the heat generated by the servers
  2. Power Usage: Monitoring and managing the power consumption of the servers
  3. Power Supply: Maintaining a stable and reliable power supply to the server room
  4. Resource Check:
    • Power Resource: Verifying the ability to provide the necessary power supply for the server usage
    • Cooling Resource: Checking the cooling capacity to effectively handle the heat generated by the servers
  5. Anomaly Detection: Identifying any anomalies or unusual patterns in the server room’s behavior
  6. Stability: Maintaining the power and cooling resource supply to meet or exceed the server usage requirements
  7. Optimizing: Based on the stability analysis, optimizing the power and cooling resource supply to match the server usage

The key focus is on the appropriate management and provisioning of both power and cooling resources to ensure the overall stability and optimization of the server room operations.