Multi-DCs Operation with a LLM (2)

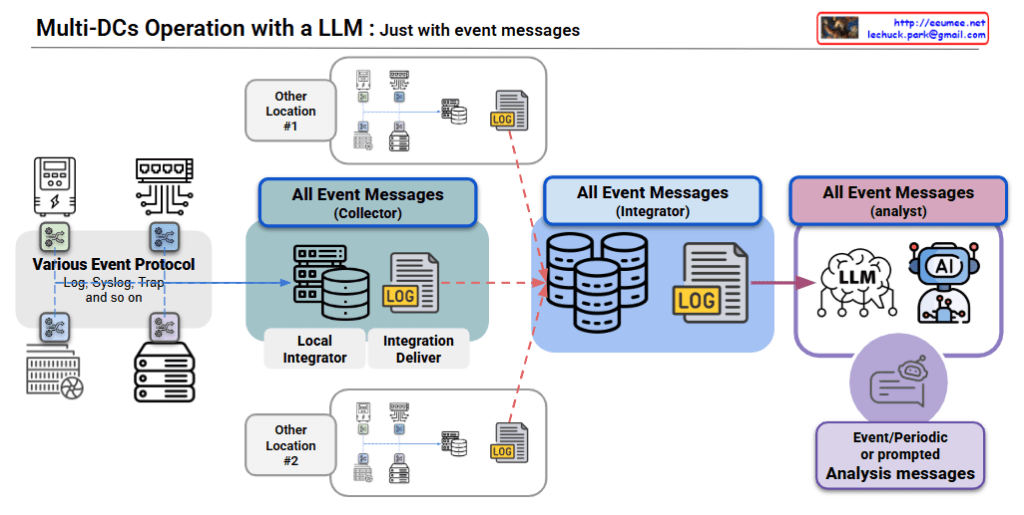
This diagram illustrates a Multi-Data Center Operation with LLM architecture system configuration.

Overall Architecture Components

Left Side – Event Sources:

  • Various systems supporting different event protocols (Log, Syslog, Trap, etc.) generating events

Middle – 3-Stage Processing Pipeline:

  1. Collector – Light Blue
    • Composed of Local Integrator and Integration Deliver
    • Collects and performs initial processing of all event messages
  2. Integrator – Dark Blue
    • Stores/manages event messages in databases and log files
    • Handles data integration and normalization
  3. Analyst – Purple
    • Utilizes LLM and AI for event analysis
    • Generates event/periodic or immediate analysis messages

Core Efficiency of LLM Operations Integration (Bottom 4 Features)

  • Already Installed: Leverages pre-analyzed logical results from existing alert/event systems, enabling immediate deployment without additional infrastructure
  • Highly Reliable: Alert messages are highly deterministic data that significantly reduce LLM error possibilities and ensure stable analysis results
  • Easy Integration: Uses pre-structured alert messages, allowing simple integration with various systems without complex data preprocessing
  • Nice LLM: Operates reliably based on verified alert data and provides an optimal strategy for rapidly applying advanced LLM technology

Summary

This architecture enables rapid deployment of advanced LLM technology by leveraging existing alert infrastructure as high-quality, deterministic input data. The approach minimizes AI-related risks while maximizing operational intelligence, offering immediate deployment with proven reliability.

With Claude

Multi-DCs Operation with a LLM (1)

This diagram illustrates a Multi-Data Center Operations Architecture leveraging LLM (Large Language Model) with Event Messages.

Key Components

1. Data Collection Layer (Left Side)

  • Collects data from various sources through multiple event protocols (Log, Syslog, Trap, etc.)
  • Gathers event data from diverse servers and network equipment

2. Event Message Processing (Center)

  • Collector: Comprises Local Integrator and Integration Deliver to process event messages
  • Integrator: Manages and consolidates event messages in a multi-database environment
  • Analyst: Utilizes AI/LLM to analyze collected event messages

3. Multi-Location Support

  • Other Location #1 and #2 maintain identical structures for event data collection and processing
  • All location data is consolidated for centralized analysis

4. AI-Powered Analysis (Right Side)

  • LLM: Intelligently analyzes all collected event messages
  • Event/Periodic or Prompted Analysis Messages: Generates automated alerts and reports based on analysis results

System Characteristics

This architecture represents a modern IT operations management solution that monitors and manages multi-data center environments using event messages. The system leverages LLM technology to intelligently analyze large volumes of log and event data, providing operational insights for enhanced data center management.

The key advantage is the unified approach to handling diverse event streams across multiple locations while utilizing AI capabilities for intelligent pattern recognition and automated response generation.

With Claude

ALL to LLM

This image is an architecture diagram titled “ALL to LLM” that illustrates the digital transformation of industrial facilities and AI-based operational management systems.

Left Section (Industrial Equipment):

  • Cooling tower (cooling system)
  • Chiller (refrigeration/cooling equipment)
  • Power transformer (electrical power conversion equipment)
  • UPS (Uninterruptible Power Supply)

Central Processing:

  • Monitor with gears: Equipment data collection and preprocessing system
  • Dashboard interface: “All to Bit” analog-to-digital conversion interface
  • Bottom gears and human icon: Manual/automated operational system management

Right Section (AI-based Operations):

  • Purple area with binary code (0s and 1s): All facility data converted to digital bit data
  • Robot icons: LLM-based automated operational systems
  • Document/analysis icons: AI analysis results and operational reports

Overall, this diagram represents the transformation from traditional manual or semi-automated industrial facility operations to a fully digitized system where all operational data is converted to bit-level information and managed through LLM-powered intelligent facility management and predictive maintenance in an integrated operational system.

With Claude

DC Changes

This image shows a diagram that matches 3 Environmental Changes in data centers with 3 Operational Response Changes.

Environmental Changes → Operational Response Changes

1. Hyper Scale

Environmental Change: Large-scale/Complexity

  • Systems becoming bigger and more complex
  • Increased management complexity

→ Operational Response: DevOps + Big Data/AI Prediction

  • Development-Operations integration through DevOps
  • Intelligent operations through big data analytics and AI prediction

2. New DC (New Data Center)

Environmental Change: New/Edge and various types of data centers

  • Proliferation of new edge data centers
  • Distributed infrastructure environment

→ Operational Response: Integrated Operations

  • Multi-center integrated management
  • Standardized operational processes
  • Role-based operational framework

3. AI DC (AI Data Center)

Environmental Change: GPU Large-scale Computing/Massive Power Requirements

  • GPU-intensive high-performance computing
  • Enormous power consumption

→ Operational Response: Digital Twin – Real-time Data View

  • Digital replication of actual configurations
  • High-quality data-based monitoring
  • Real-time predictive analytics including temperature prediction

This diagram systematically demonstrates that as data center environments undergo physical changes, operational approaches must also become more intelligent and integrated in response.

with Claude

CI/CD

From Claude with some prompting
Let me explain this CI/CD (Continuous Integration/Continuous Delivery & Deployment) pipeline diagram:

  1. Continuous Integration section:
  • Code Dev: Developers writing code
  • Commit: Code submission to repository
  • Build: Building the code
  • Unit Test: Running unit tests
  • Valid Check: Validation checks
  • Integration Test: Running integration tests
  1. Continuous Delivery & Deployment section:
  • Release Automation: Automated release process
  • Automated deployment: System for automatic deployment
  • Rollback capabilities: Ability to revert to previous versions if issues occur
  1. Additional Management Features:
  • Monitoring: System monitoring
  • Environment Management: Managing different environments
  • Analysis & Control: Analysis and control functions

This diagram illustrates the automated workflow in modern software development, from code creation to deployment. Each stage is automated, improving the efficiency and reliability of the development process.

Key highlights:

  • Automated testing processes
  • Continuous integration workflow
  • Automated deployment system
  • Stability through monitoring and rollback features

The flow shows three parallel development streams that converge into integration testing, followed by release automation and deployment. The entire process is monitored and controlled with proper environment management.

This CI/CD pipeline is crucial in modern DevOps practices, helping organizations:

  • Deliver software faster
  • Maintain high quality standards
  • Reduce manual errors
  • Enable quick recovery from issues
  • Provide consistent development and deployment processes

The pipeline emphasizes automation at every stage, making software development more efficient and reliable while maintaining quality control throughout the process.

Automatic Control System

From Claude with some prompting
focusing on the importance of computing in automatic control systems and the distinction between devices with sufficient computing power and those without:

  1. Basic Structure of Automatic Control System:
    • The system operates in the sequence of Sensing -> Data IN -> CPU -> Out -> Action.
    • This entire process occurs within the ‘Computing’ phase, which is crucial for automatic control.
  2. Device Classification Based on Computing Capability:
    • ‘Nice Computing Inside’: Represents devices with sufficient computing power. These devices can process complex control logic independently.
    • ‘Nice Computing Outside’: Indicates devices with limited computing capabilities. These devices rely on external computing resources for automatic control.
  3. Utilization of External Computing Resources:
    • The ‘External Computing Device’ allows devices with limited computing power to perform advanced automatic control functions.
    • This is implemented through external computing devices such as PLCs (Programmable Logic Controllers) or DDCs (Direct Digital Controls).
  4. System Integration:
    • ‘Interface & API’ facilitates the connection and communication between various devices and external computing resources.
    • The ‘Integration’ section demonstrates how these diverse elements function as a unified automatic control system.
  5. Importance of Computing:
    • In automatic control systems, computing plays a crucial role in data processing, decision-making, and generating control commands.
    • By appropriately utilizing internal or external computing resources, various types of equipment can function as part of an efficient automatic control system.

This diagram effectively illustrates the flexibility and scalability of automatic control systems, explaining different approaches based on computing capabilities. The forthcoming explanation about PLC/DDC and other external computing devices will likely provide more concrete insights into the practical implementation of these systems.

Integration DC

From Claude with some prompting
This diagram depicts an architecture for data center (DC) infrastructure expansion and integrated operations management across multiple sites. The key features include:

  1. Integration and monitoring of comprehensive IT infrastructure at the site level, including networks, servers, storage, power, cooling, and security.
  2. Centralized management of infrastructure status, events, and alerts from each site through the “Integration & Alert Main” system.
  3. The central integration system collects diverse data from sites and performs data integration and analysis through the “Service Integration” layer:
    • Data integration, private networking, synchronization, and analysis of new applications
    • Inclusion of advanced AI-based data analytics capabilities
  4. Leveraging analysis results to support infrastructure system optimization and upgrade decisions at each site.
  5. Improved visibility, control, and efficiency over the entire DC infrastructure through centralized monitoring and integration.

This architecture enables unified management of distributed infrastructure resources in an expanded DC environment and enhances operational efficiency through data-driven optimization.

By consolidating monitoring and integrating data analytics, organizations can gain comprehensive insights, make informed decisions, and streamline operations across their distributed data center footprint.