This infographic provides a highly structured and clear overview of Chiplet technology, dividing the subject into its core concept, essential technological elements, and primary business advantages.
1. The Concept of a Chiplet (Left Section)
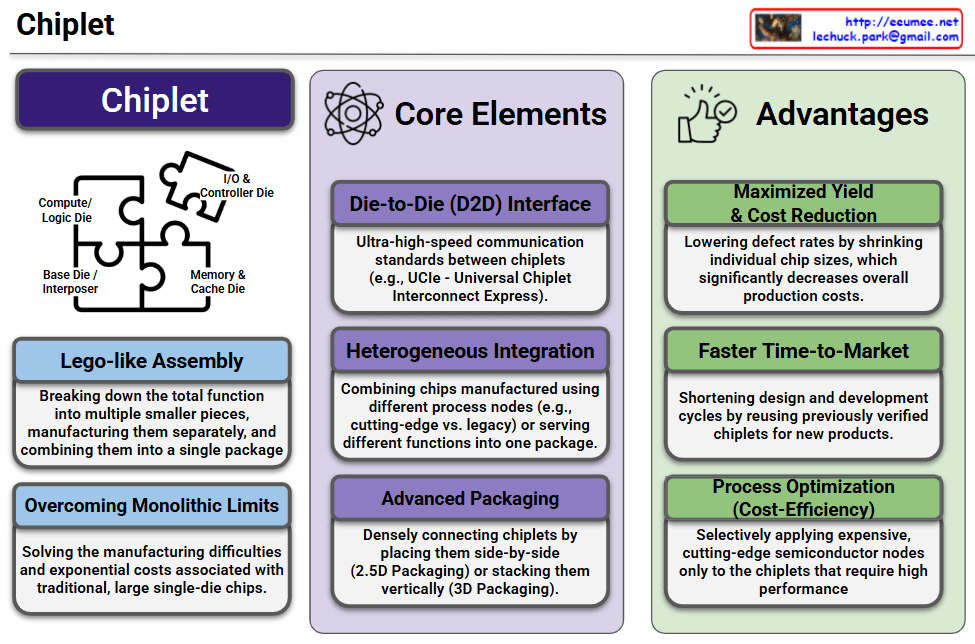
- Visual Metaphor: The jigsaw puzzle perfectly illustrates the architecture of a chiplet-based system. It shows distinct functional dies—Compute/Logic Die, I/O & Controller Die, and Memory & Cache Die—fitting together onto a Base Die / Interposer to form a complete processor.
- Lego-like Assembly: Instead of manufacturing one massive chip, the total processing function is broken down into smaller, specialized pieces (chiplets). These are manufactured separately and then assembled into a single unified package.
- Overcoming Monolithic Limits: This modular approach directly solves the physical manufacturing challenges and the exponential costs associated with traditional, large single-die (monolithic) semiconductors.
2. Core Elements (Middle Section)
This section highlights the three foundational technologies required to make chiplets function seamlessly:
- Die-to-Die (D2D) Interface: This refers to the ultra-high-speed communication standards (such as the UCIe – Universal Chiplet Interconnect Express) that allow the physically separated chiplets to exchange data with minimal latency, acting as one cohesive unit.
- Heterogeneous Integration: This is the technological capability to combine chips manufactured using entirely different process nodes (e.g., pairing a cutting-edge 3nm compute node with a mature 14nm I/O node) or serving completely different functions into one single package.
- Advanced Packaging: The intricate physical process of densely connecting these chiplets, whether by placing them side-by-side on a silicon interposer (2.5D Packaging) or stacking them vertically like a skyscraper (3D Packaging).
3. Advantages (Right Section)
The rightmost column outlines the strategic and financial benefits of adopting the chiplet architecture:
- Maximized Yield & Cost Reduction: Smaller chiplets are statistically much less prone to manufacturing defects than large monolithic chips. Shrinking the individual die size lowers defect rates, maximizes wafer yield, and drastically reduces overall production costs.
- Faster Time-to-Market: Semiconductor companies can reuse existing, pre-verified chiplet designs (like “off-the-shelf” I/O or memory controllers) for new products. This significantly shortens the design, research, and development cycles.
- Process Optimization (Cost-Efficiency): It allows for extreme cost-efficiency by reserving the most expensive, cutting-edge semiconductor nodes exclusively for the chiplets that demand the highest performance (like the main logic), while using cheaper, legacy nodes for less demanding components.
📌 Summary
Chiplet technology represents a critical paradigm shift in semiconductor manufacturing. By transitioning from monolithic designs to a modular, “lego-like” assembly—enabled by advanced packaging, heterogeneous integration, and high-speed D2D interfaces—the industry can overcome physical scaling limits. This architecture not only slashes manufacturing costs and improves yield but also accelerates innovation, making it the foundational technology driving today’s high-performance AI accelerators and advanced data center operations.
#Chiplet #Semiconductor #AdvancedPackaging #HeterogeneousIntegration #UCIe #AIChips #HighPerformanceComputing #HPC #TechInfographic #TechInnovation
With Gemini