Power Efficiency Cost

AI Data Center Power Efficiency Analysis

The Power Design Dilemma in AI Data Centers

AI data centers, comprised of power-hungry GPU clusters and high-performance servers, face critical decisions where power efficiency directly impacts operational costs and performance capabilities.

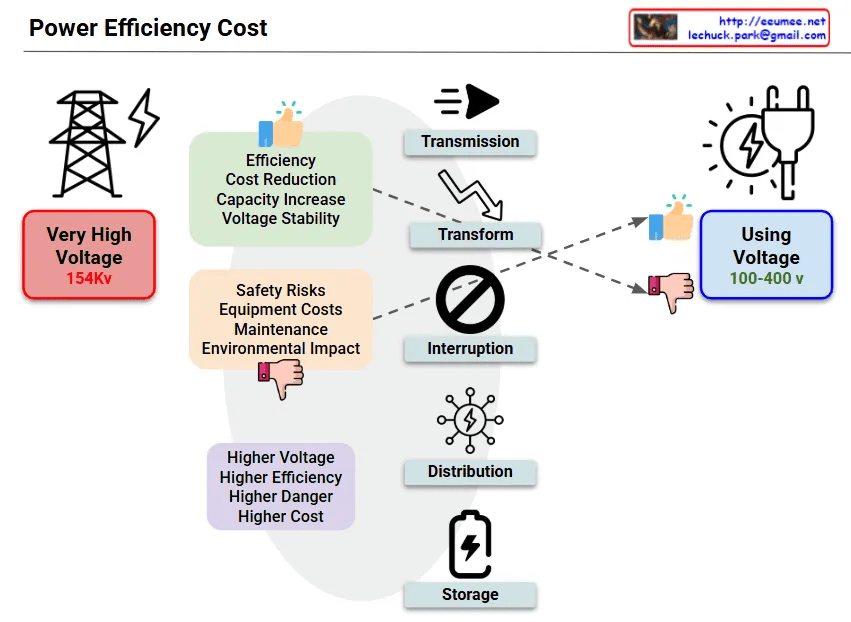
The Need for High-Voltage Distribution Systems

  • AI Workload Characteristics: GPU training operations consume hundreds of kilowatts to megawatts continuously
  • Power Density: High power density of 50-100kW per rack demands efficient power transmission
  • Scalability: Rapid power demand growth following AI model size expansion

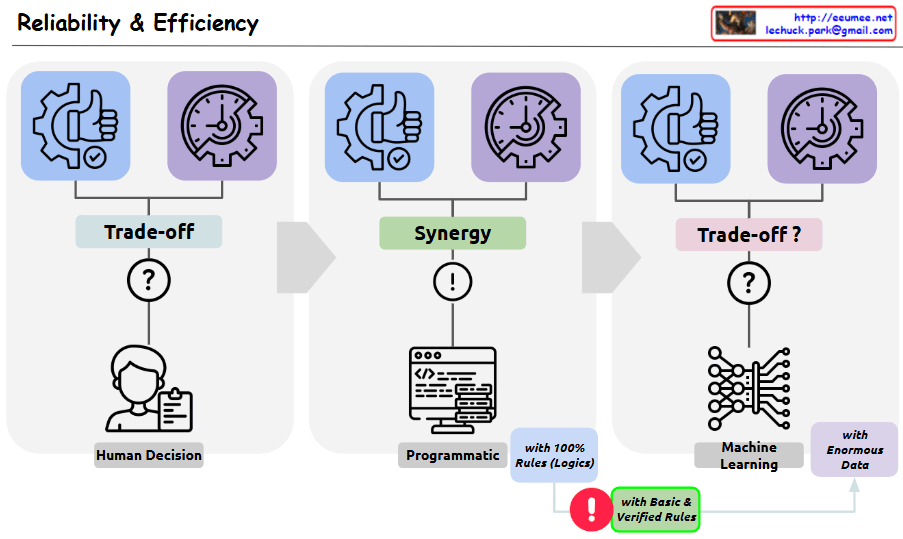
Efficiency vs Complexity Trade-offs

Advantages (Efficiency Perspective):

  • Minimized Power Losses: High-voltage transmission dramatically reduces I²R losses (potential 20-30% power cost savings)
  • Cooling Efficiency: Reduced power losses mean less heat generation, lowering cooling costs
  • Infrastructure Investment Optimization: Fewer, larger cables can deliver massive power capacity

Disadvantages (Operational Complexity):

  • Safety Risks: High-voltage equipment requires specialized expertise, increased accident risks
  • Capital Investment: Expensive high-voltage transformers, switchgear, and protection equipment
  • Maintenance Complexity: Specialized technical staff required, extended downtime during outages
  • Regulatory Compliance: Complex permitting processes for electrical safety and environmental impact

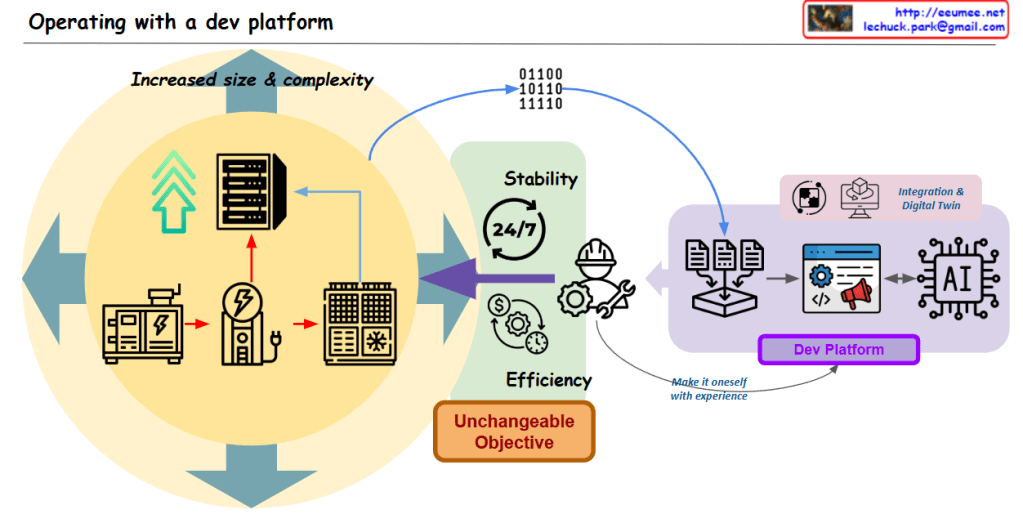
AI DC Power Architecture Design Strategy

  1. Medium-Voltage Distribution: 13.8kV → 480V stepped transformation balancing efficiency and safety
  2. Modularization: Pod-based power delivery for operational flexibility
  3. Redundant Backup Systems: UPS and generator redundancy preventing AI training interruptions
  4. Smart Monitoring: Real-time power quality surveillance for proactive fault prevention

Financial Impact Analysis

  • CAPEX: 15-25%(?) higher initial investment for high-voltage infrastructure
  • OPEX: 20-35%(?) reduction in power and cooling costs over facility lifetime
  • ROI: Typically 18-24(?) months payback period for hyperscale AI facilities

Conclusion

AI data centers must identify the optimal balance between power efficiency and operational stability. This requires prioritizing long-term operational efficiency over initial capital costs, making strategic investments in sophisticated power infrastructure that can support the exponential growth of AI computational demands while maintaining grid-level reliability and safety standards.

with Claude

Reliability & Efficiency

This image is a diagram showing the relationship between Reliability and Efficiency. Three different decision-making approaches are compared:

  1. First section – “Trade-off”:
    • Shows Human Decision making
    • Indicates there is a trade-off relationship between reliability and efficiency
    • Displays a question mark (?) symbol representing uncertainty
  2. Second section – “Synergy”:
    • Shows a Programmatic approach
    • Labeled as using “100% Rules (Logic)”
    • Indicates there is synergy between reliability and efficiency
    • Features an exclamation mark (!) symbol representing certainty
  3. Third section – “Trade-off?”:
    • Shows a Machine Learning approach
    • Labeled as using “Enormous Data”
    • Questions whether the relationship between reliability and efficiency is again a trade-off
    • Displays a question mark (?) symbol representing uncertainty

Importantly, the “Basic & Verified Rules” section at the bottom presents a solution to overcome the indeterminacy (probabilistic nature and resulting trade-offs) of machine learning. It emphasizes that the rules forming the foundation of machine learning systems should be simple and clearly verifiable. By applying these basic and verified rules, the uncertainty stemming from the probabilistic nature of machine learning can be reduced, suggesting an improved balance between reliability and efficiency.

with Claude

Operating with a dev Platform

with a Claude’s help
The main points covered in this image are:

  1. Increased Size and Complexity of Data
  • The central upward-pointing arrow indicates that the size and complexity of data is increasing.
  1. Key Operational Objectives
  • The three main operational goals presented are Stability, Efficiency, and an “Unchangeable Objective”.
  • Stability is represented by the 24/7 icon, indicating the need for continuous, reliable operation.
  • Efficiency is depicted through various electrical/mechanical icons, suggesting the need for optimized resource utilization.
  • The “Unchangeable Objective” is presented as a non-negotiable goal.
  1. Integration, Digital Twin, and AI-based Development Platform
  • To manage the increasing data and operations, the image shows the integration of technologies like Digital Twin.
  • An AI-powered Development Platform is also illustrated, which can “make it [the operations] itself with experience”.
  • This Development Platform seems to leverage AI to help achieve the stability, efficiency, and unchangeable objectives.
  1. Interconnected Elements
  • The image demonstrates the interconnected nature of the growing data, the key operational requirements, and the technological solutions.
  • The Development Platform acts as a hub, integrating data and AI capabilities to support the overall operational goals.

In summary, this image highlights the challenges posed by the increased size and complexity of data that organizations need to manage. It presents the core operational objectives of stability, efficiency, and immutable goals, and suggests that an integrated, AI-powered development platform can help address these challenges by leveraging the synergies between data, digital technologies, and autonomous problem-solving capabilities.

Stability + Efficiency = Optimization

From Claude with some prompting
This image illustrates the concept of optimization, which is achieved through a balance between stability and efficiency.

  1. Stability:
    • Represented by the 24-hour clock icon, this refers to the consistency and reliability of a system over time.
  2. Efficiency:
    • Depicted by the gear/dollar sign icon, this represents the ability to maximize output or performance with minimal resources.
  3. Trade-off:
    • The central element shows the conflicting relationship between stability and efficiency.
    • Humans struggle to achieve both stability and efficiency simultaneously.
  4. Programmatic Automation:
    • The system icon suggests that automation or programmatic control can enable a “win-win” scenario, where both stability and efficiency can be optimized.
    • Systems have the capability to overcome the “trade-off” tendency that humans often exhibit.
  5. Optimization:
    • Represented by the gear and chart icon, this is the final, optimized state achieved through the balance of stability and efficiency.
    • By combining the human “trade-off” tendency and the system’s “win-win” capability, a more integrated optimization can be attained.

In summary, this image contrasts the differences between human and system approaches in the pursuit of optimization. By leveraging the strengths of both, the optimal balance between stability and efficiency can be achieved.

By Software System

From Claude with some prompting
This image illustrates the improvement of work processes through a software system. It’s divided into two parts, with the left side showing manual work and the right side depicting work done through a software system.

Left side (Manual):

  1. Work: Represented by a wrench icon
  2. Process: Shown as a flowchart-like icon
  3. Stability and Efficiency are shown in a trade-off relationship with arrows

Right side (Software System):

  1. Automation: Depicted by a rotating gear icon
  2. Optimization: Represented by an ascending graph icon
  3. Long Jump: Shown with a clock and hourglass icon
    • Described as “Get great results over a long period of time”
  4. Both Stability and Efficiency are shown to increase with upward arrows

The image demonstrates that implementing a software system can simultaneously improve stability and efficiency, and through automation and optimization, achieve significant long-term results.

This diagram effectively contrasts the limitations of manual processes with the benefits of implementing a software system for work processes.