Digital Twin

From DALL-E with some prompting
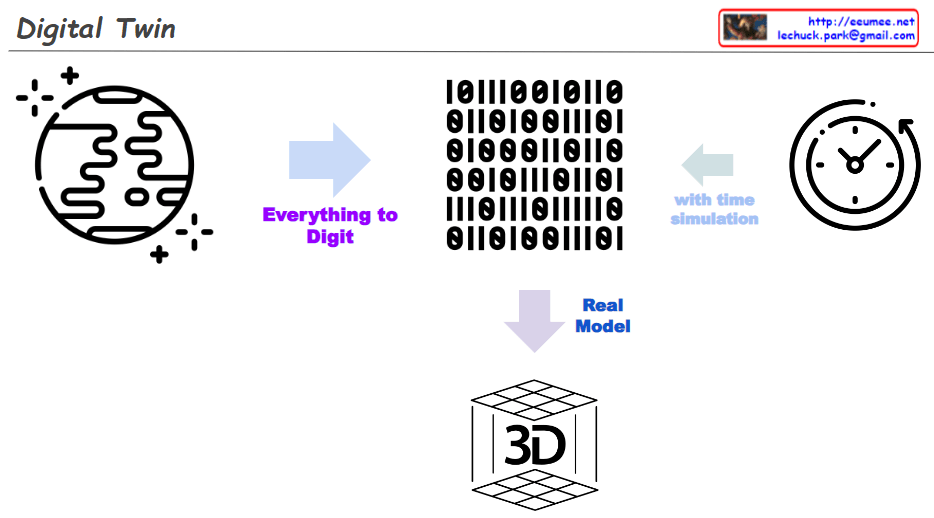
This image depicts a conceptual diagram for a “Digital Twin.”

  • In the top left, there’s an icon representing a physical object, resembling the Earth with dots and lines, indicating complexity and connectivity.
  • A rightward arrow from the object leads to a phrase “Everything to Digit,” suggesting the transformation of a physical object into digital data.
  • The top right block is filled with binary codes, representing digital information.
  • Next to this block, there’s an icon of a clock with the phrase “with time simulation,” indicating the process includes temporal changes or predictions over time.
  • An arrow points downward to the phrase “Real Model,” signifying the creation of a practical model from the digital information and simulations.
  • At the bottom, there’s a 3D cube labeled “3D,” symbolizing the digital twin’s realization as a three-dimensional model.

A digital twin is a virtual replica of a physical object or system, bridging the physical and digital worlds. It can be used for real-time analytics, system monitoring, troubleshooting, and predictive maintenance. The diagram visually represents the process of creating a digital twin, omitting personal or organizational contact information that is present in the image.

3 for Datacenter

From DALL-E with some prompting
This image visually represents “3 Key Strategies for DC Operation.”

  1. Transform
    • Digitalization: Transitioning data centers to digital technology.
      • KPI (Key Performance Indicators)
      • PUE (Power Usage Effectiveness) & Monitoring
      • Automation
      • Data API Service
  2. Use
    • Data Platform: Establishing platforms for data management and utilization.
      • Standardization
      • Platform
      • Continuous Upgrade
      • New!!
  3. Verify
    • AI: Validating efficiency and performance of data centers through AI.
      • Real AI
      • Early Warning
      • Energy Operation

These three strategies are interconnected with three objectives: “Experience to Digital,” “Continuous Innovation,” and “AI DC Now!!” This illustrates that the operation of data centers is moving towards impacting humans through digitalization, innovation, and the application of AI technology, driving transformation across the industry.

Exp to the AI

From DALL-E with some prompting
The image outlines a transformative process in AI development:

Experience to Data: This depicts the conversion of real-world experiences into digital data. Icons indicate a brain or cognition and a gear mechanism, symbolizing the process of understanding and systematizing experiences.

Digital to Platform: The transformed data is then standardized on a platform. Icons of servers and a microchip suggest data storage and processing.

Platform Makes New & AI: Utilizing the standardized data, the platform facilitates the creation of new AI services. Icons of an AI chip and a symbol for ‘new’ represent the innovation and development of AI applications.

Overall, the image emphasizes the value of converting experiences into a digital format that can be standardized on a platform to drive the creation of innovative AI services.

Network Monitoring with AI

from DALL-E with some prompting
The image portrays a network monitoring system enhanced by AI, specifically utilizing deep learning. It shows a flow from the network infrastructure to the identification of an event, characterized by computed data with time information and severity. The “One Event” is clearly defined to avoid ambiguity. The system identifies patterns such as the time gap between events, event count, and relationships among devices and events, which are crucial for a comprehensive network analysis. AI deep learning algorithms work to process additional data (add-on data) and ambient data to detect anomalies and support predictive maintenance within the network.

Works with data

From DALL-E with some prompting
The image describes a data workflow process that involves various stages of data handling and utilization for operational excellence. “All Data” from diverse sources feeds into a monitoring system, which then processes raw data, including work logs. This raw data undergoes ETL (Extract, Transform, Load) procedures to become structured “ETL-ed Data.” Following ETL, the data is analyzed with AI to extract insights and inform decisions, which can lead to actions such as maintenance. The ultimate goal of this process is to achieve operational excellence, automation, and efficiency.

Data types

From DALL-E with some prompting
The image classifies data types and emphasizes the need for verification and response to potential errors for each type.

Computed Data: Processed by the CPU, with an implication of potential issues during computing or AI processing before storage.
Machine Data: Originating from machines or sensors, requiring error checking before storage, and awareness of possible errors.
Human Data: Entered by humans, needing verification due to the potential inclusion of wrong information, and awareness of errors.
This classification underlines the importance of ensuring accuracy in data processing and the need to be aware of and respond to potential errors.

Service cycle

From DALL-E with some prompting
The image depicts a “Service Cycle” comprising several phases in a service’s lifecycle. These phases are visually represented and include “Design,” “Build constructions,” and “Operation management.” Additionally, the cycle includes “Commissioning” and “Continuous (sustainable) Maintenance & Upgrade” stages, emphasizing the ongoing process of maintaining and upgrading services. The flow of information through “Configuration Data,” “Operation Data,” and “Data Analysis” is also presented, highlighting the importance of data in managing and improving service operations.