From ChatGPT with some prompting The image illustrates the complexity of AI processing and underscores the importance of the process. It begins with data collected from various sources like people, industry, nature, and at a microcosmic level, space or atoms, which is fed into an AI system. This data is processed through what is labeled as ‘Super Parallel Computing’, indicating a level of complexity that is described as ‘unexplainable’—suggesting the intricate and potentially incomprehensible nature of AI computations. However, a red ‘X’ button marked with ‘IF wrong Data/translate’ indicates the necessity to correct the data if it is incorrect or improperly translated, emphasizing that even advanced computing can lead to negative outcomes, as represented by the vague small character marked as ‘bad result’, if the input data is flawed. The term ‘WOW’ signifies the astonishing results AI can produce when functioning correctly, yet this is contingent on the quality and accuracy of the input data.
Overall, this diagram serves as a visual warning that the power of AI technology is reliant on the integrity of its data. Inaccurate data can lead to adverse outcomes, even with the use of sophisticated AI, as highlighted by the image’s contrast between the potential for amazement and the risk of poor results.
From Copilot with some prompting The image you shared represents a diagram titled “Facility Data Spec.” Here’s the description:
Image Description:
The diagram depicts the process of defining data requirements centered around facility-based data management.
On the left side, there’s an icon representing a “Facility,” which is connected to elements such as data generation rate, hardware interface, and software protocol.
A relay network (symbolized by gears) is linked to the facility and leads to an IP port.
The IP port connects to a TCP/IP network represented by circuit lines, ultimately leading to a data point.
The data point includes elements like data explanations and data units.
At the top right corner of the image, there are URLs and an email address.
Summary:
The diagram illustrates how data is generated within a facility, transmitted through various networks and protocols, and ultimately represented as data points.
This diagram provides valuable insights for managing facility-related data requirements. Understanding and effectively managing data specifications at the facility level is crucial for efficient data management.
From Gemini with some prompting Facility-centric data definition for facility data management Facility data management is the process of systematically collecting, storing, managing, and analyzing data generated from facilities. Facility data includes information on the facility’s condition, operation, and production. Facility data management can lead to the following benefits:
Improved facility efficiency Prediction and prevention of facility failures Increased productivity Energy savings Facility-centric data definition is a data definition approach that centers on facilities. It offers the following benefits:
Data consistency Improved data accessibility Increased data usability The diagram illustrates the following facility-centric data definition requirements for facility data management:
Facility: The facility is the entity that generates data. Different types of facilities exist, and each type generates different data. Data point: A data point is a unit of data generated from a facility. It includes the data name, data type, and data value. Network: The network is a communication network that connects facilities and data points. Data generated from facilities is transmitted to data points through the network. Data repository: The data repository is a place where data is stored. Different types of data repositories exist, and each type has different characteristics. Data processing: Data processing is the process of analyzing and utilizing data. It includes data cleaning, data analysis, and data visualization. Facility-centric data definition requirements for facility data management:
Data consistency: Facility-centric data definition should ensure data consistency. Data names, data types, and data values should be standardized to maintain data consistency. Data accessibility: Facility-centric data definition should improve data accessibility. The data repository should be appropriately selected, and data access permissions should be managed to enhance data accessibility. Data usability: Facility-centric data definition should increase data usability. Data analysis tools should be utilized, and data-driven decision-making should be implemented to improve data usability. Conclusion:
Facility-centric data definition requirements should be considered for facility data management. Facility-centric data definition can enhance data consistency, accessibility, and usability, leading to improved facility efficiency, productivity, and energy efficiency.
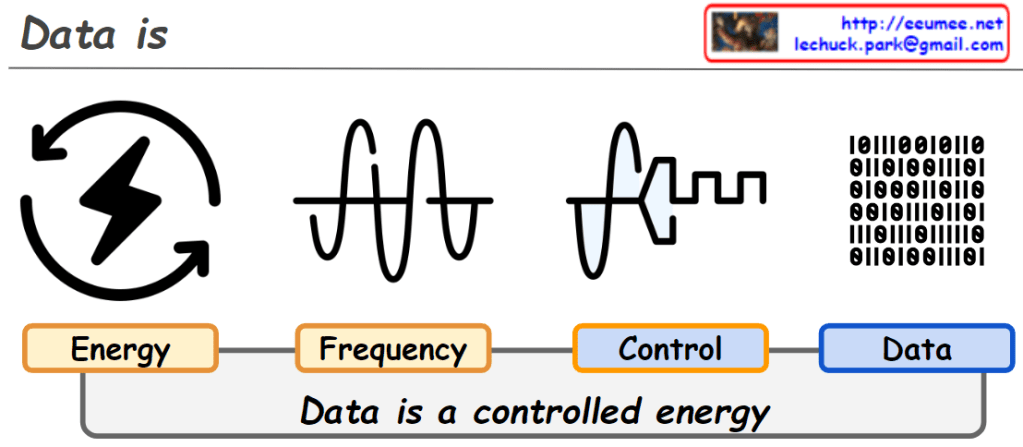
From DALL-E with some prompting The image conveys the concept that data fundamentally stems from energy, which is harnessed and controlled to create meaningful information. It illustrates a progression from an energy symbol to a sine wave representing frequency, followed by a rectangular waveform symbolizing control, culminating in binary code blocks that represent data. The diagram encapsulates the idea that data is a form of controlled energy, systematically transformed to serve our purposes.
From DALL-E with some prompting The diagram provides a visual summary of how data from industrial facilities is aggregated and transformed through various processes, including equipment operation and business requirements. This data flow is depicted starting from the left, moving through icons representing servers, databases, safety equipment, and surveillance, indicating the collection and integration of diverse data types. The central AI chip symbolizes the analytical engine that processes this vast array of information, optimizing it for business intelligence and operational efficiency.
The processed data then feeds into a Large Language Model (LLM), highlighted in the diagram as the interface for communication. The AI’s capacity to analyze and manage this data results in a conversational output that closely resembles human interaction, as suggested by the “Like Human” label on the diagram. The integration of complex technical data with nuanced language processing allows the AI to communicate effectively with humans, symbolized by the network graphic on the right, which represents human connections.
In essence, the image encapsulates the journey of raw data from mechanical and logistical origins to sophisticated human-like dialogue, emphasizing the role of AI in bridging the gap between the technical and the personal in contemporary business environments.
From Gemini with some prompting Image Interpretation: Using AI, Deep Learning, and Quantum Computing for Data Analysis to Drive Future Advancement
Limitations of Data Interpretation: Human Effort and Computing
Humans have traditionally interpreted data through note-taking and computing. However, human interpretation capabilities have reached their limits as data volumes have grown.
AI, Deep Learning, and Quantum Computing: New Possibilities for Data Interpretation
Advances in Artificial Intelligence (AI), Deep Learning, and Quantum Computing technologies have opened up new possibilities for data interpretation. These technologies can analyze data much faster and more accurately than humans.
Next Step Advancement through Data Analysis
Data analysis using AI, Deep Learning, and Quantum Computing technologies can lead to advancements in the following areas: Scientific Research: New drug development, new material development, environmental problem solving, etc. Healthcare: Disease diagnosis and treatment, personalized healthcare services, etc. Industry: Production efficiency improvement, new product development, new business model discovery, etc. Society: Social problem-solving, policy decision support, safety and security reinforcement, etc.
Conclusion: Data Analysis, the Key to the Future
Data analysis using AI, Deep Learning, and Quantum Computing technologies will be the key driver of future development. Through data analysis, we can create a better future.
From DALL-E with some prompting The image conceptualizes the evolution and advancement in data processing. Initially, data understandable at a human level is processed using traditional note-taking and computing methods. This is represented by a simple binary code and is processed using tools symbolized by the human brain and computers.
However, the emergence of larger and more complex datasets necessitated new tools that extend beyond human processing capabilities. As illustrated at the bottom of the image, an extended binary code represents the data that must be handled by advanced tools based on Artificial Intelligence (AI), Deep Learning, and Quantum Physics. This data format is interpretable by machines, specifically AI created by humans.
These advanced tools enable the meaningful analysis of complex data, leading to the “Analysis & Development” stage depicted on the right side of the image. This signifies how insights derived from the processing are used to solve real-world problems and drive new developments.
Therefore, this image is more than a description of data processing methods; it provides an overview of how modern technologies are managing massive datasets and how the resulting analyses can lead to tangible advancements and development goals.
From DALL-E with some prompting This image appears to be a conceptual diagram of an individual’s AI agent, divided into several parts:
Personal Area: There’s a user icon with arrows labeled ‘Control’ and ‘Sensing All’. This suggests the user can direct the AI agent and the AI is capable of gathering comprehensive information from its environment.
Micro & Macro Infinite World: This part features illustrations that seem to represent microorganisms, plants, butterflies, etc., indicating that the AI collects data from both microscopic and macroscopic environments.
Personalized Resource: The icon resembling a human brain could represent personalized services or data tailored to the user.
Cloud Infra: The cloud infrastructure is presumably responsible for data processing and storage.
Cloud Service: Depicted as a server providing various services, connected to the cloud infrastructure.
Internet Connected: A globe icon with various network points suggests that the AI agent is connected to global information and knowledge via the internet.
Overall, the diagram illustrates a personalized AI agent that collects information under the user’s control, processes it through cloud infrastructure and services, and ultimately contributes to collective intelligence through an internet connection.
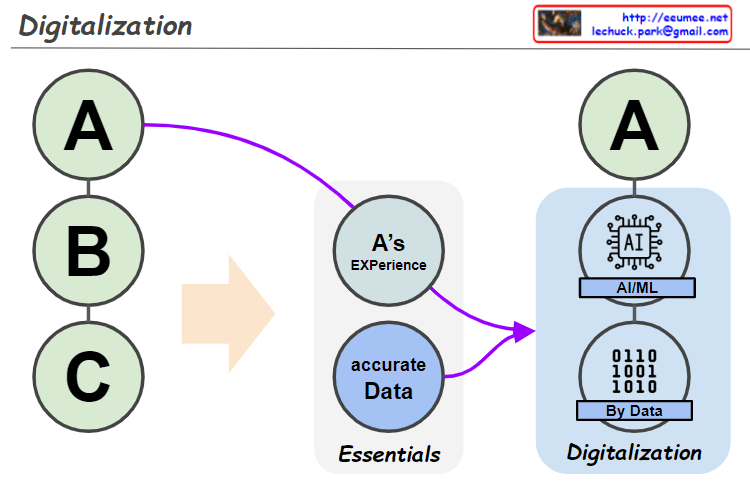
From DALL-E with some prompting The image depicts three levels of experience, A, B, and C, highlighting that while A represents a high level of experience, levels B and C can be enhanced through digital transformation using data and AI technologies. This transformation underscores that the collection and analysis of accurate data are essential elements, as they lay the foundation for AI systems to perform sophisticated learning, thus improving operational efficiency and precision.
The integration of individual experiences and precise data is not merely a technical shift but also prompts significant changes in human resource management within organizations. By incorporating their expertise into digital platforms, employees can strengthen the organization’s knowledge base and contribute to their own professional development.
Ultimately, this digital transformation should be sustainable and maintain a human-centric approach, ensuring that the increase in operational efficiency through AI alleviates the workload on employees, fostering creativity and enhancing the organizational culture and values.