From Claude with some prompting The image titled “Connections of minorities” compares “Before” and “Now” scenarios:
“Before”:
Large blue circles (representing the majority) are connected and growing.
Small black circles (representing minorities) are isolated.
Caption: “Only the majority connects and grows.”
“Now”:
Large blue circles remain connected, but small black circles start connecting.
New large black circles appear, connecting the minorities.
Caption: “Minorities also can make connections.”
A central element labeled “Data Collector (Internet)” and “AI Data Processor” suggests these changes are due to internet and AI technology advancements.
The bottom asks: “The Minor is Good or Bad???, The Major also”. This prompts consideration of whether increased connections for minorities and majorities are positive or negative.
Overall, the image illustrates how technological progress has provided minorities with more opportunities for connection, and invites reflection on the implications of these changes.CopyRet
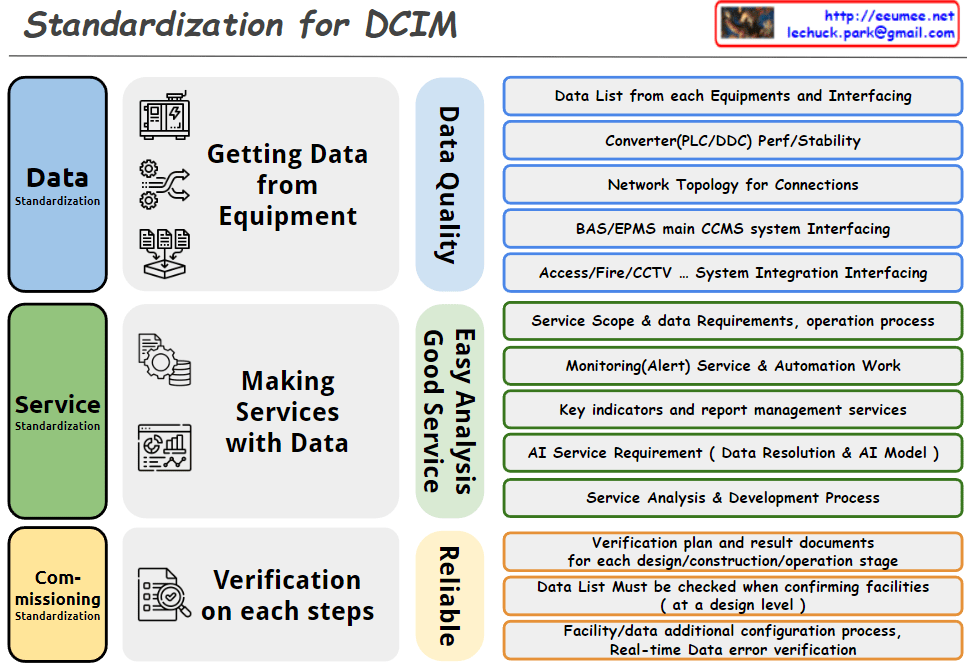
From Claude with some prompting Data Standardization:
Defined a clear process for systematically collecting data from equipment.
Proposed an integrated data management approach, including network topology and interfacing between various systems.
Emphasized data quality management as a key factor to establish a reliable data foundation.
Service Standardization:
Structured the process of connecting data to actual services.
Highlighted practical service implementation, including monitoring services and automation tasks.
Specified AI service requirements, showing a forward-looking approach.
Established a foundation for continuous service improvement by including service analysis and development processes.
Commissioning Standardization:
Emphasized verification plans and documentation of results at each stage of design, construction, and operation to enable quality management throughout the entire lifecycle.
Prepared an immediate response system for potential operational issues by including real-time data error verification.
Considered system scalability and flexibility by incorporating processes for adding facilities and data configurations.
Overall Evaluation:
This DCIM standardization approach comprehensively addresses the core elements of data center infrastructure management. The structured process, from data collection to service delivery and continuous verification, is particularly noteworthy. By emphasizing fundamental data quality management and system stability while considering advanced technologies like AI, the approach is both practical and future-oriented. This comprehensive framework will be a valuable guideline for the implementation and operation of DCIM.
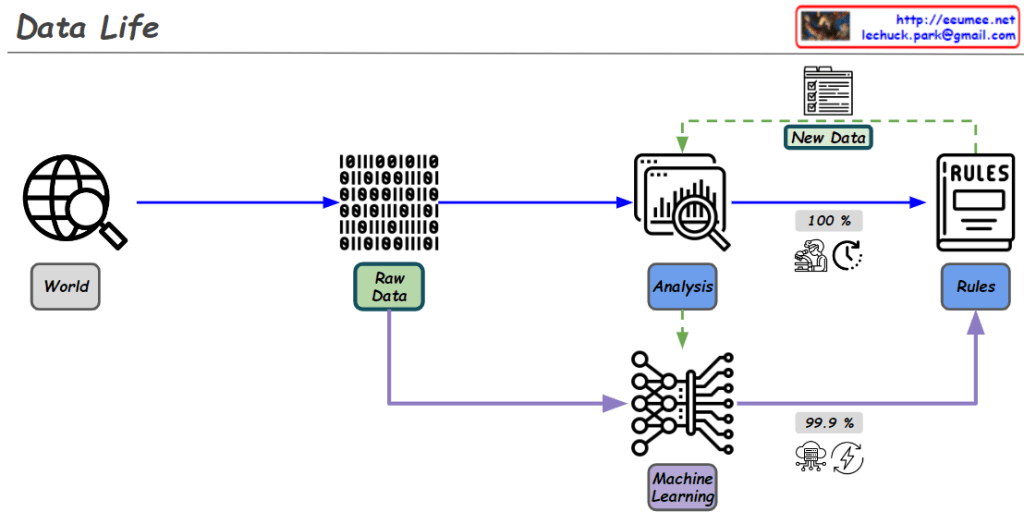
From ChatGPT with some prompting reflecting the roles of human research and AI/machine learning in the data process:
Diagram Explanation :
World:
Data is collected from the real world. This could be information from the web, sensor data, or other sources.
Raw Data:
The collected data is in its raw, unprocessed form. It is prepared for analysis and processing.
Analysis:
The data is analyzed to extract important information and patterns. During this process, rules are created.
Rules Creation:
This step is driven by human research.
The human research process aims for logical and 100% accurate rules.
These rules are critical for processing and analyzing data with complete accuracy. For example, creating clear criteria for classifying or making decisions based on the data.
New Data Generation:
New data is generated during the analysis process, which can be used for further analysis or to update existing rules.
Machine Learning:
In this phase, AI models (rules) are trained using the data.
AI/machine learning goes beyond human-defined rules by utilizing vast amounts of data through computing power to achieve over 99% accuracy in predictions.
This process relies heavily on computational resources and energy, using probabilistic models to derive results from the data.
For instance, AI can identify whether an image contains a cat or a dog with over 99% accuracy based on the data it has learned from.
Overall Flow Summary :
Human research establishes logical rules that are 100% accurate, and these rules are essential for precise data processing and analysis.
AI/machine learning complements these rules by leveraging massive amounts of data and computing power to find high-probability results. This is done through probabilistic models that continuously improve and refine predictions over time.
Together, these two approaches enhance the effectiveness and accuracy of data processing and prediction.
This diagram effectively illustrates how human logical research and AI-driven data learning work together in the data processing lifecycle.
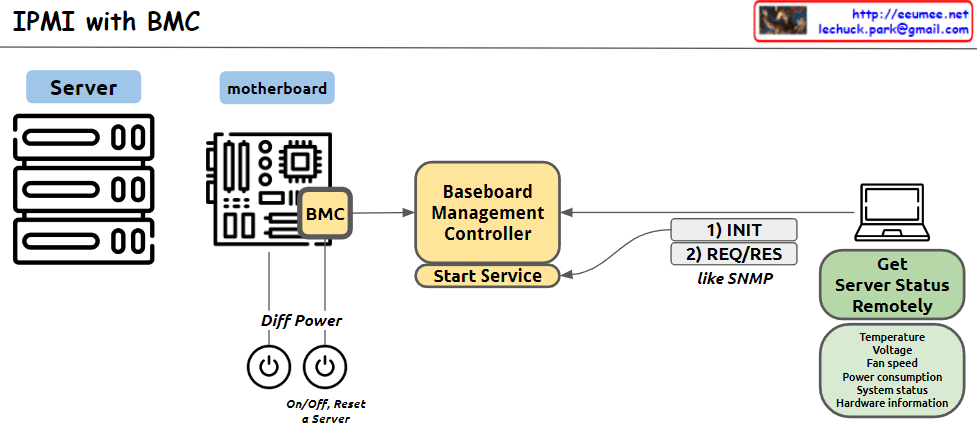
From Claude with some prompting This image illustrates the structure of an IPMI (Intelligent Platform Management Interface) system using BMC (Baseboard Management Controller). The main components and functions are as follows:
Server: Represents the managed server.
Motherboard: Depicts the server’s mainboard, where the BMC chip is located.
BMC (Baseboard Management Controller): The core component for monitoring and managing server hardware.
Baseboard Management Controller: Performs the main functions of the BMC, with a “Start Service” function indicated.
Diff Power: Represents the server’s power management functions, including On/Off and Reset capabilities.
Remote management computer: Used to remotely monitor and manage the server status.
Get Server Status Remotely: Server status information that can be checked remotely, including temperature, voltage, fan speed, power consumption, system status, and hardware information.
Communication process: The interaction between the remote computer and BMC is shown to involve 1) INIT (initialization) and 2) REQ/RES (request/response) stages, described as functioning similar to SNMP.
This system allows administrators to remotely monitor and control the physical state of the server.
From Claude with some prompting focusing on the importance of the digital twin-based floor operation optimization system for high-performance computing rooms in AI data centers, emphasizing stability and energy efficiency. I’ll highlight the key elements marked with exclamation points.
Purpose of the system:
Enhance stability
Improve energy efficiency
Optimize floor operations
Key elements (marked with exclamation points):
Interface:
Efficient data collection interface using IPMI, Redis and Nvidia DCGM
Real-time monitoring of high-performance servers and GPUs to ensure stability
Intelligent/Smart PDU:
Precise power usage measurement contributing to energy efficiency
Early detection of anomalies to improve stability
High Resolution under 1 sec:
High-resolution data collection in less than a second enables real-time response
Immediate detection of rapid changes or anomalies to enhance stability
Analysis with AI:
AI-based analysis of collected data to derive optimization strategies
Utilized for predictive maintenance and energy usage optimization
Computing Room Digital Twin:
Virtual replication of the actual computing room for simulation and optimization
Scenario testing for various situations to improve stability and efficiency
This system collects and analyzes data from high-power servers, power distribution units, cooling facilities, and environmental sensors. It optimizes the operation of AI data center computing rooms, enhances stability, and improves energy efficiency.
By leveraging digital twin technology, the system enables not only real-time monitoring but also predictive maintenance, energy usage optimization, and proactive response to potential issues. This leads to improved stability and reduced operational costs in high-performance computing environments.
Ultimately, this system serves as a critical infrastructure for efficient operation of AI data centers, energy conservation, and stable service provision. It addresses the unique challenges of managing high-density, high-performance computing environments, ensuring optimal performance while minimizing risks and energy consumption.
From Claude with some prompting This image presents a concept diagram titled “One Point”. It illustrates the process from the smallest unit in the universe to human data collection.
Key elements include:
“The Point”: Representing the smallest unit.
“From the universe”:
Quantum: Symbolized by an atom icon
Energy: Depicted with a lightning bolt icon
“Sensing”: Shown as a yellow arrow process
“By Humans”:
“0 and 1”: Representing digital data
“Diff”: Likely indicating data processing
“Data”: The final output
“gathering”: The process from 0 and 1 to Data
At the bottom, there’s an infinity symbol with the phrase “not much different (infinite by the view of micro & macro)”. This suggests little difference between microscopic and macroscopic perspectives.
This image illustrates the evolution of problem-solving approaches, contrasting traditional methods with modern AI-based solutions:
‘Before’ stage:
Starts with Simple data
Proceeds through Research
Find out Rules with formula
Resolves Complex problems
This process represents the traditional approach where humans collect simple data, conduct research, and discover rules to solve complex problems.
‘Now with AI Infra’ stage:
Begins with Simple data
Accumulates too much Simple data
Utilizes Computing for big data and Computing AI
Solves Complex problems by too much simple
This new process showcases a modern approach based on AI infrastructure. It involves analyzing vast amounts of simple data using computational power to address more evolved forms of complexity.
The ‘Complex Evolution’ arrow indicates that the level of complexity we can handle is evolving due to this shift in approach.
In essence, the image conveys that while the past relied on limited data to discover simple rules for solving complexity, the present leverages AI and big data to analyze enormous amounts of simple data, enabling us to tackle more sophisticated and complex problems. This shift represents a significant evolution in our problem-solving capabilities, allowing us to address complexities that were previously beyond our reach.