With Claude
Server Room Metric Correlation Analysis & Operations Guide
1. Diagram Structure Analysis
Key Component Areas
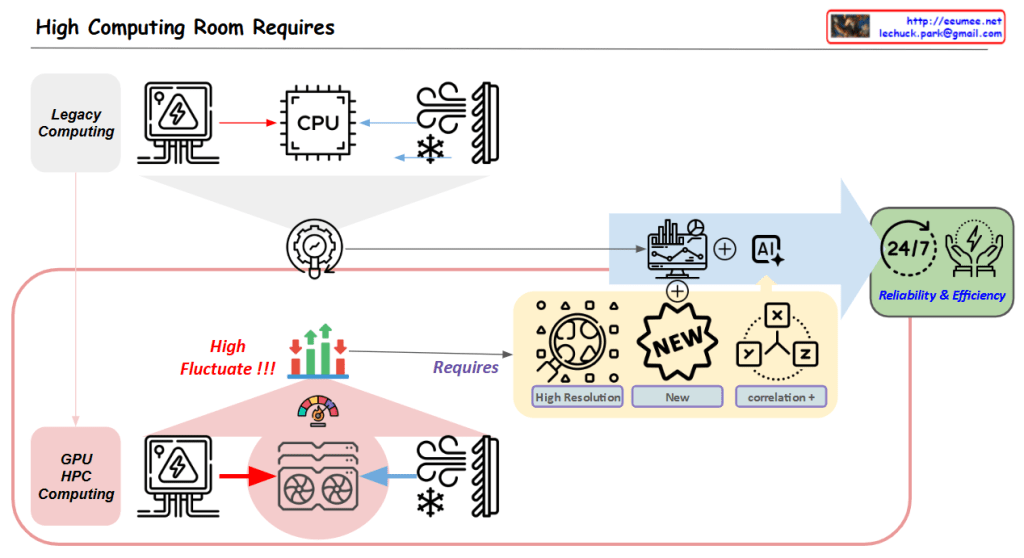
- Server Zone (Left)
- Server racks and equipment
- Workload-driven CPU/GPU operations
- Load metrics indicating rising system demands
- Resource utilization monitoring
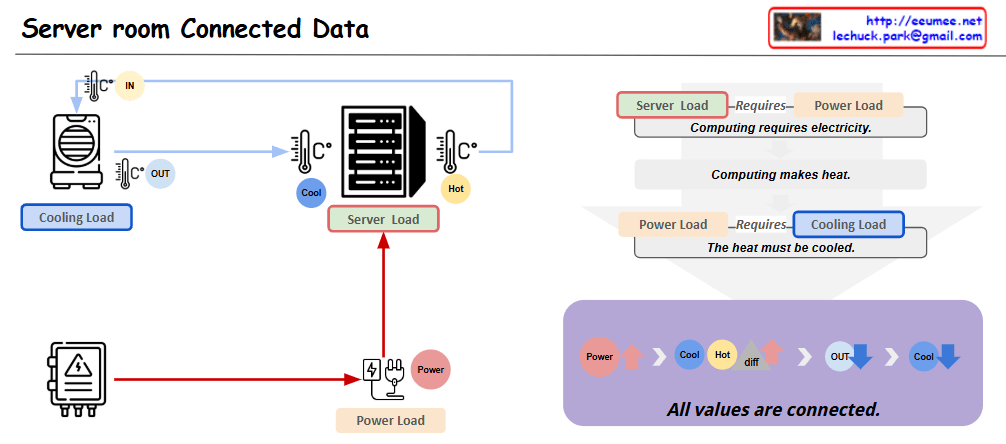
- Power Supply Zone (Center Bottom)
- Power metering system
- Power consumption monitoring
- Load status tracking with increasing indicators
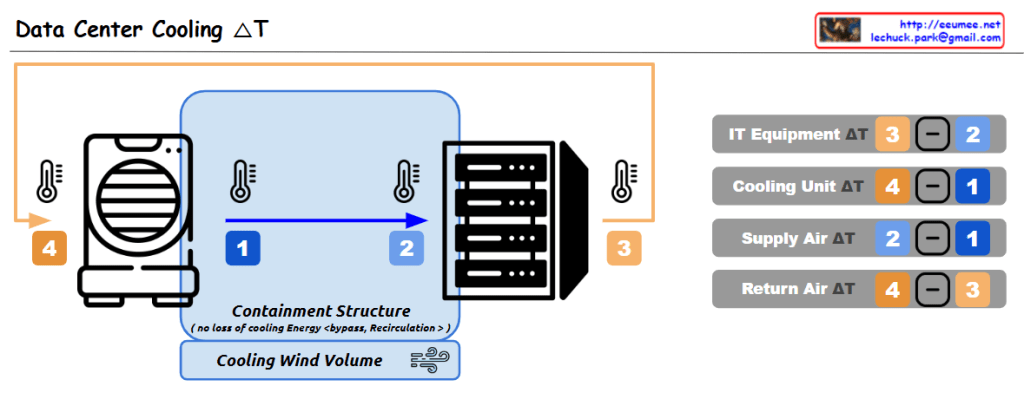
- Hot Zone (Center)
- Heat generation and thermal management area
- Exhaust temperature monitoring
- Return temperature tracking
- Overall temperature management
- Cool Zone (Right)
- Cooling system operations
- Inlet temperature control
- Cooling supply temperature management
- Cooling system load monitoring
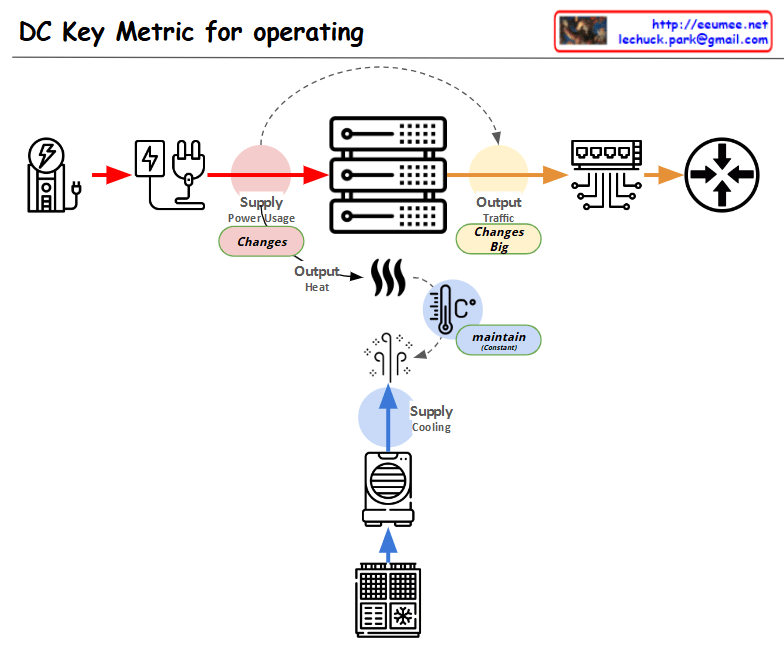
2. Core Metric Correlations
Basic Metric Flow
- Load Generation
- Server workload increases
- CPU/GPU utilization rises
- System load elevation
- Power Consumption
- Load-driven power usage increase
- Power efficiency monitoring
- Overall system load tracking
- Thermal Management
- Heat generation in Hot Zone
- Exhaust/Return temperature differential
- Cooling system response
- Cooling Efficiency
- Cool Zone temperature regulation
- Cooling system load adjustment
- System stability maintenance
3. Key Operational Indicators
Primary Metrics
- Performance Metrics
- Server workload levels
- CPU/GPU utilization
- System response metrics
- Environmental Metrics
- Zone temperatures
- Air flow patterns
- Cooling efficiency
- Power Metrics
- Power consumption rates
- Load distribution
- Efficiency indicators
4. Monitoring Focus Points
Critical Correlations
- Load-Power-Temperature Relationship
- Workload impact on power consumption
- Heat generation patterns
- Cooling system response efficiency
- System Stability Indicators
- Temperature zone balance
- Power distribution effectiveness
- Cooling system performance
This comprehensive analysis of server room metrics and their correlations enables effective monitoring and management of the entire system, ensuring optimal performance and stability through understanding the interconnected nature of all components and their respective metrics.
The diagram effectively illustrates how different metrics interact and influence each other, providing a clear framework for monitoring and maintaining server room operations efficiently.