Computing is ..

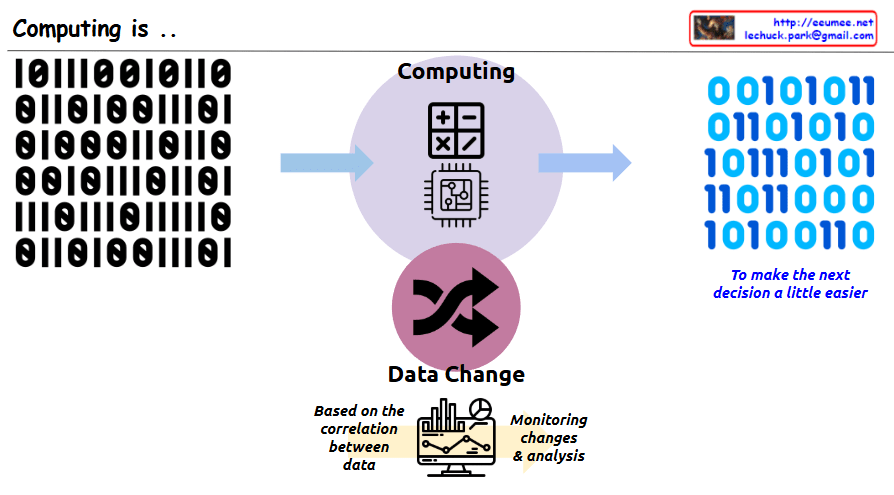
This image illustrates the core concept of “Computing.” The key message is that computing is a process of transforming data to make people’s next decisions easier.

In the center, there is a circle with the title “Computing” along with calculator and computer chip icons. On the left side, there is binary input data (0s and 1s), which is shown being transformed through the central computing process into different binary output on the right side. Next to the binary output on the right is blue italic text saying “To make the next decision a little easier,” emphasizing that the purpose of this data transformation is to aid human decision-making.

At the bottom of the image, there is a section titled “Data Change” with cycling arrows representing data transformation. Below that, there’s a monitor displaying charts and graphs with descriptions “Based on the correlation between data” and “Monitoring changes & analysis,” showing that analyzing relationships between data is important for supporting decision-making.

With Claude

Data Center NOW

This image shows a data center architecture diagram titled “Data Center Now” at the top. It illustrates the key components and flow of a modern data center infrastructure.

The diagram depicts:

  1. On the left side: An “Explosion of data” icon with data storage symbols, pointing to computing components with the note “More Computing is required”
  2. In the center: Server racks connected to various systems with colored lines indicating different connections (red, blue, green)
  3. On the right side: Several technology components illustrated with circular icons and labels:
    • “Software Defined” with a computer/gear icon
    • “AI & GPU” with neural network and GPU icons and note “Big power is required”
    • “Renewable Energy & Grid Power” with solar panel and wind turbine icons
    • “Optimized Cooling /w Using Water” with cooling system icon
    • “Enhanced Op System & AI Agent” with a robotic/AI system icon

The diagram shows how data flows through processing units and connects to different infrastructure elements, emphasizing modern data center requirements like increased computing power, AI capabilities, power management, and cooling solutions.

With Claude

Add with power

Add with Power: 8-Bit Binary Addition and Energy Transformation

Core Mechanism:

  1. Input: Two 8-energy binary states (both rows ending with 1)
  2. Computation Process: 1+1 = 2 (binary overflow occurs)
  3. Result:
    • Output row’s last bit changed to 0
    • Part of energy converted to heat

Key Components:

  • Two input rows with 8 binary “energies”
  • Computing symbol (+) representing addition
  • A heat generation (?) box marked x8
  • Resulting output row with modified energy state

Fundamental Principle: “All energies must be maintained with continuous energies for no error (no changes without Computing)”

This diagram illustrates:

  • Binary addition process
  • Energy conservation and transformation
  • Information loss during computation
  • Relationship between computation, energy, and heat generation

The visual representation shows how a simple 8-bit addition triggers energy transfer, with overflow resulting in heat production and a modified binary state.

WIth Claude

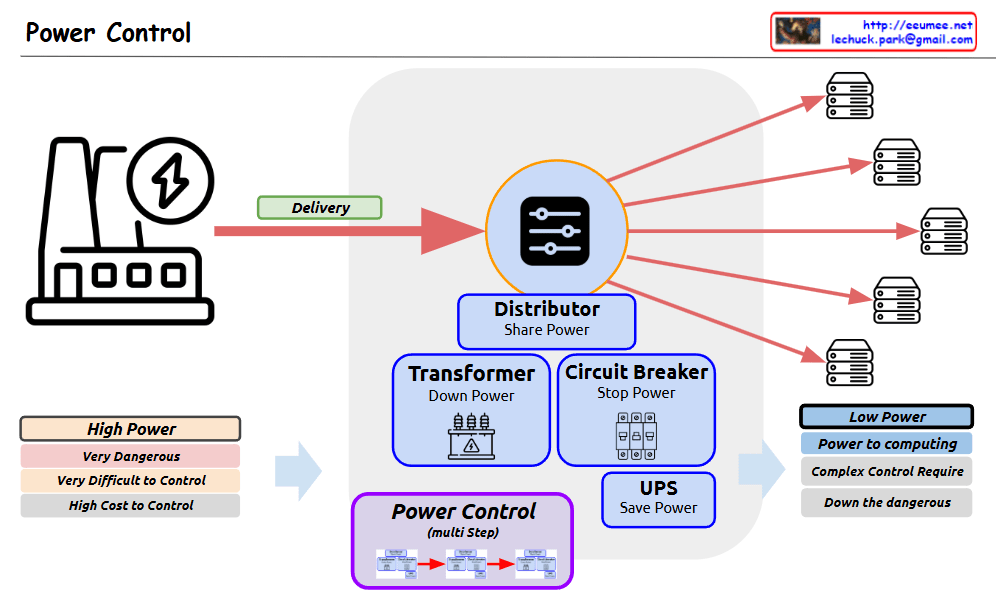
Power Control

Power Control system diagram

  1. Power Source (Left Side)
  • High Power characteristics:
    • Very Dangerous
    • Very Difficult to Control
    • High Cost to Control
  1. Central Control/Distribution System (Center)
  • Distributor: Shares/distributes power
  • Transformer: Steps down power
  • Circuit Breaker: Stops power
  • UPS (Uninterruptible Power Supply): Saves power
  • Power Control (multi-step)
  1. Final Distribution (Right Side)
  • Low Power characteristics:
    • Power for computing
    • Complex Control Required
    • Reduced dangers

The diagram shows the complete process of how high-power electricity is safely and efficiently controlled and converted into low-power suitable for computing systems. The power flow is illustrated through a “Delivery” phase, passing through various protective and control devices before being distributed to multiple servers or computing equipment.

The system emphasizes safety and control through multiple stages:

  • Initial high-power input is marked as dangerous and difficult to control
  • Multiple control mechanisms (transformer, circuit breaker, UPS) manage the power
  • The distributor splits the controlled power to multiple endpoints
  • Final output is appropriate for computing equipment

This setup ensures safe and reliable power distribution while reducing the risks associated with high-power electrical systems.

With Claude

Fast Copy over network

With a Claude
This image illustrates a system architecture diagram for “Fast Copy over network”. Here’s a detailed breakdown:

  1. Main Sections:
  • Fast Copy over network
  • Minimize Copy stacks
  • Minimize Computing
  • API optimization for read/write
  1. System Components:
  • Basic computing layer including OS (Operating System) and CPU
  • RAM (memory) layer
  • Hardware device layer
  1. Key Features:
  • The purple area on the left focuses on minimizing Count & Copy with API
  • The blue center area represents minimized computing works (Program Code)
  • The orange area on the right shows programmable API implementation
  1. Data Flow:
  • Arrows indicating bi-directional communication between systems
  • Vertical data flow from OS to RAM to hardware
  • Horizontal data exchange between systems

The architecture demonstrates a design aimed at optimizing data copying operations over networks while efficiently utilizing system resources.

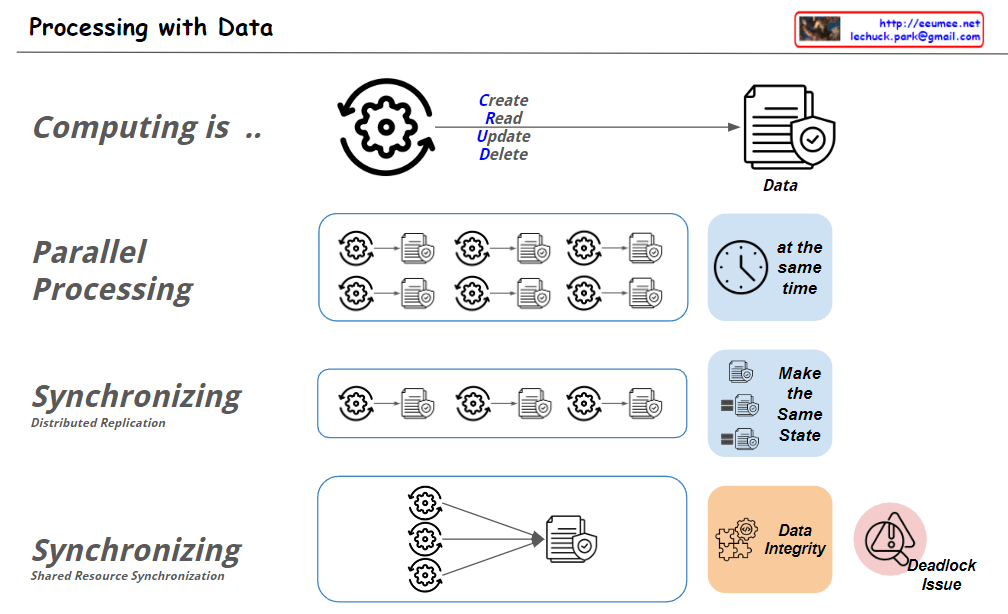
Processing with Data

From Claude with some prompting
This image illustrates “Processing with Data” concepts. Here’s an interpretation of the key elements:

  1. Computing:
    • Shown as a cycle of Create, Read, Update, Delete (CRUD) operations on data.
  2. Parallel Processing:
    • Depicts multiple processes running simultaneously, labeled “at the same time”.
  3. Synchronizing – Distributed Replication:
    • Illustrates multiple processes being synchronized to “Make the Same State”.
  4. Synchronizing – Shared Resource Synchronization:
    • Shows multiple processes accessing a single shared resource.
    • Highlights “Data Integrity” and “Deadlock Issue” as important considerations.

The image uses simple icons and diagrams to visually explain various aspects of data processing, making complex concepts more accessible.

New Infra Age

From Claude with some prompting
This diagram illustrates the cyclical evolution of computing infrastructure, emphasizing the re-entry into a new computing infrastructure era driven by AI technology:

  1. Development cycle:
    • Traditional infrastructure era (Infra age) → Software era (SW Age) → New infrastructure era (New Infra age)
  2. Core elements of the new infrastructure era:
    • AI/ML (highlighted with red circles): Processing humanity’s accumulated experiences and data
    • GPU: Key computing infrastructure for AI
  3. Driving forces of development:
    • More Users
    • More Data
    • These are visualized by the icons at the bottom
  4. Key connection points (highlighted with red circles):
    • PC: Increased user base due to personal computer proliferation
    • Internet: Enhanced global connectivity
    • Web: Improved information accessibility
    • Mobile: Anytime, anywhere access environment
    • AI/ML: Processing and utilization of accumulated data
  5. Cyclical development:
    • User increase → Data increase → Infrastructure development to process this data → Attraction of more users, creating a cyclical structure

This diagram emphasizes that as AI technology begins to comprehensively process and utilize humanity’s accumulated experiences and data, it necessitates the expansion of new GPU-centric computing infrastructure to support this. It demonstrates a cyclical structure where processing more users and data leads to further infrastructure development, which in turn enables handling even more users and data.