Automatic Control System

From Claude with some prompting
focusing on the importance of computing in automatic control systems and the distinction between devices with sufficient computing power and those without:

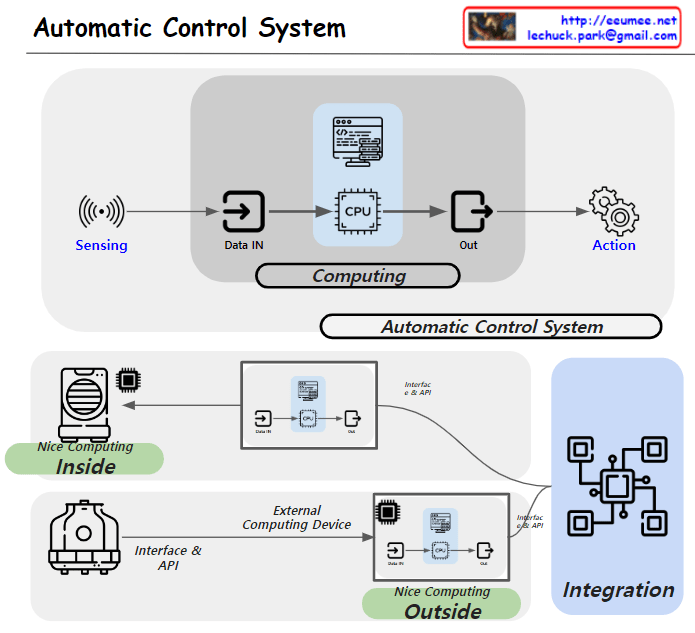
  1. Basic Structure of Automatic Control System:
    • The system operates in the sequence of Sensing -> Data IN -> CPU -> Out -> Action.
    • This entire process occurs within the ‘Computing’ phase, which is crucial for automatic control.
  2. Device Classification Based on Computing Capability:
    • ‘Nice Computing Inside’: Represents devices with sufficient computing power. These devices can process complex control logic independently.
    • ‘Nice Computing Outside’: Indicates devices with limited computing capabilities. These devices rely on external computing resources for automatic control.
  3. Utilization of External Computing Resources:
    • The ‘External Computing Device’ allows devices with limited computing power to perform advanced automatic control functions.
    • This is implemented through external computing devices such as PLCs (Programmable Logic Controllers) or DDCs (Direct Digital Controls).
  4. System Integration:
    • ‘Interface & API’ facilitates the connection and communication between various devices and external computing resources.
    • The ‘Integration’ section demonstrates how these diverse elements function as a unified automatic control system.
  5. Importance of Computing:
    • In automatic control systems, computing plays a crucial role in data processing, decision-making, and generating control commands.
    • By appropriately utilizing internal or external computing resources, various types of equipment can function as part of an efficient automatic control system.

This diagram effectively illustrates the flexibility and scalability of automatic control systems, explaining different approaches based on computing capabilities. The forthcoming explanation about PLC/DDC and other external computing devices will likely provide more concrete insights into the practical implementation of these systems.

Changes of the network traffic

From Claude with some prompting
Here’s an interpretation of the diagram in English, focusing on the major changes in internet traffic types:

  1. Early Internet (Start): The small “Bytecode” circle represents the limited data exchange of the early internet. This period was primarily characterized by simple, text-based information exchange.
  2. Web Era (Web): The larger “bytecode HTTP” circle illustrates the surge in HTTP traffic with the advent of the World Wide Web. This represents increased traffic from web browsing, email, and early online services.
  3. Streaming Age (Streaming): The addition of the “Video Streaming” circle signifies the explosive growth in video streaming traffic, driven by platforms like YouTube and Netflix. This marks a paradigm shift in internet bandwidth usage.
  4. Big Data and AI Era (Big Data IoT / Machine Learning & LLM): The largest circle, “Big Data For AI,” represents the enormous traffic increase due to IoT device proliferation, cloud computing ubiquity, and large-scale data processing for AI and machine learning. This suggests it now constitutes the largest portion of internet traffic.

This diagram effectively shows the evolution of internet traffic from simple data exchange to web-based services, media streaming, and the current data-centric, AI-driven era.

Comments (points to be cautious about):

  1. Accuracy: It’s unclear if the circle sizes accurately reflect actual traffic volumes. This should be understood as a conceptual representation.
  2. Time scale: The time intervals between stages may not be uniform, which is not indicated in the diagram.
  3. Overlap: In reality, these traffic types coexist and are not as distinctly separated as the diagram suggests.
  4. Recent trends: The diagram doesn’t reflect traffic changes due to latest technological trends like 5G or edge computing.
  5. Regional differences: These changes may not have occurred uniformly worldwide, which is not reflected in the diagram.

It’s important to consider these points when interpreting the diagram. Overall, this image effectively conveys the macroscopic trends in the evolution of internet traffic in a concise and impactful manner.

Both are equally unexplainable

From Claude with some prompting
This image compares human intelligence and artificial intelligence, emphasizing that both are “equally unexplainable” in certain aspects:

  1. Human Intelligence:
    • Uses 100% math and logic, but based on limited experience and data.
    • Labeled “Not 100% depend on Experience,” indicating experience alone is insufficient.
    • When decision-making under time constraints, humans make the “best choice” rather than a 100% perfect choice.
    • Shows a process of: Event → Decision with Time Limit → Action.
  2. Artificial Intelligence:
    • Based on big data, GPU/CPU processing, and AI models (including LLMs).
    • Labeled as “Unexplainable AI Model,” highlighting the difficulty in fully interpreting AI decision-making processes.
    • Demonstrates a flow of: Data input → Neural network processing → “Nice but not 100%” output.
    • Like human intelligence, AI also makes best choices within limited data and time constraints.
  3. Key Messages:
    • AI is not a simple logic calculator but a system mimicking human intelligence.
    • AI decisions, like human decisions, are not 100% perfect but the best choice under given conditions.
    • We should neither overestimate nor underestimate AI, but understand its limitations and possibilities in a balanced way.
    • Both human and artificial intelligence have unexplainable aspects, reflecting the complexity and limitations of both systems.

This image emphasizes the importance of accurately understanding and appropriately utilizing AI capabilities by comparing it with human intelligence. It reminds us that while AI is a powerful tool, human judgment and ethical considerations remain crucial. The comparison underscores that AI, like human intelligence, is making the best possible decisions based on available data and constraints, rather than providing infallible, 100% correct answers.

Finding Rules

From Claude with some prompting
This image, titled “Finding Rules,” illustrates the contrast between two major learning paradigms:

  1. Traditional Human-Centric Learning Approach:
    • Represented by the upper yellow circle
    • “Human Works”: Learning through human language and numbers
    • Humans directly analyze data and create rules
    • Leads to programming and legacy AI systems
  2. Machine Learning (ML) Approach:
    • Represented by the lower pink circle
    • “Machine Works”: Learning through binary digits (0 and 1)
    • Based on big data
    • Uses machine/deep learning to automatically discover rules
    • “Finding Rules by Machines”: Machines directly uncover patterns and rules

The diagram showcases a paradigm shift:

  • Two coexisting methods in the process from input to output
  • Transition from human-generated rules to machine-discovered rules
  • Emphasis on data processing in the “Digital World”

Key components:

  • Input and Output: Marking the start and end of the process
  • Analysis: Central to both approaches
  • Rules: Now discoverable by both humans and machines
  • Programming & Legacy AI: Connected to the human-centric approach
  • Machine/Deep Learning: Core of the ML approach

This visualization effectively demonstrates the evolution in data analysis and rule discovery brought about by advancements in artificial intelligence and machine learning. It highlights the shift from converting data into human-readable formats for analysis to leveraging vast amounts of binary data for machine-driven rule discovery.