DC Cooling (delta)T

From Claude with some prompting
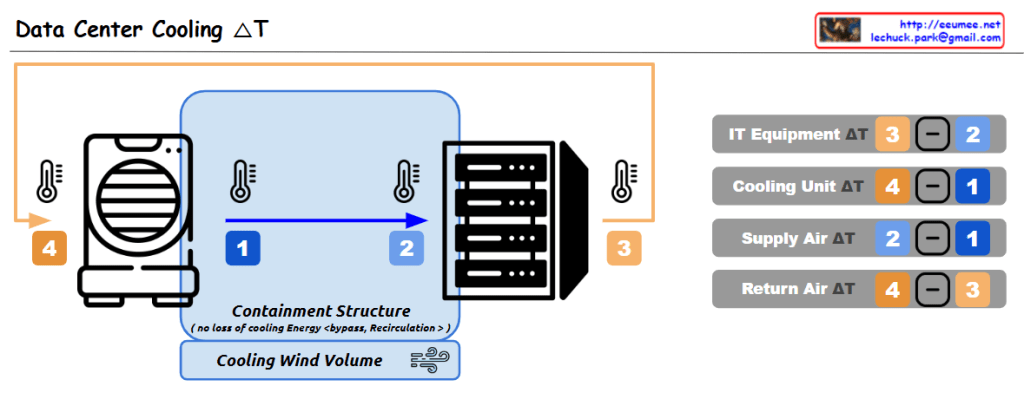
This data center cooling system utilizes a containment structure to control the airflow around the IT equipment, which helps improve cooling efficiency. The cooled air is supplied to the equipment, and the warmer exhaust air is expelled outside.

The key aspect of this system is the monitoring of temperature differences (ΔT) between the various components, which enables the following analyses and improvements:

  1. IT Equipment ΔT (3 – 2): This represents the temperature rise across the IT equipment itself, indicating the amount of heat generated by the IT hardware. Analyzing this can help identify opportunities to improve the efficiency of the IT equipment, such as through layout optimization or hardware upgrades.
  2. Cooling Unit ΔT (4 – 1): This is the temperature difference across the cooling unit, where the air is cooled. A smaller ΔT indicates higher efficiency of the cooling unit. Monitoring this metric allows for continuous evaluation and optimization of the cooling unit’s performance.
  3. Supply Air ΔT (2 – 1): This is the temperature change of the cooled air as it is supplied into the data center. A smaller ΔT here suggests the cooled air is being effectively distributed.
  4. Return Air ΔT (4 – 3): This is the temperature rise of the air as it is returned from the data center. A larger ΔT indicates the cooling system is effectively removing more heat from the data center.

These temperature difference data points are crucial baseline information for evaluating and improving the overall efficiency of the data center cooling system. By continuously monitoring and analyzing these metrics, the facility can optimize energy usage, cooling costs, and system reliability.

Biz AI Arch.

From Claude with some prompting
the AI-based enterprise document analysis/conversation service architecture:

Architectural Components:

  1. User Access Layer (On-Premises Private Biz Network)
  • User access through web interface
  • Secure access within corporate internal network environment
  1. Data Management Layer (Local Storage)
  • On-Premises Cloud Deployment support
  • Hybrid cloud environment with AWS outpost, Azure Stack, GCP
  • Secure storage of corporate documents and data
  1. Service Operation Layer (Cloud/AI Infra)
  • Enhanced security through Virtual Private Network
  • Cloud-based AI service integration
  • Document-based AI services like NotebookLM

Key Features and Benefits:

  1. Security
  • Private Network-based operation
  • Minimized data leakage risk
  • Regulatory compliance facilitation
  1. Scalability
  • Hybrid cloud architecture
  • Efficient resource management
  • Expandable to various AI services
  1. Operational Efficiency
  • Centralized data management
  • Unified security policy implementation
  • Easy monitoring and management

Considerations and Improvements:

  1. System Optimization
  • Balance between performance and cost
  • Implementation of caching system
  • Establishment of monitoring framework
  1. Future Extensibility
  • Integration potential for various AI services
  • Multi-cloud strategy development
  • Resource adjustment based on usage patterns

Technical Considerations:

  1. Performance Management
  • Network bandwidth and latency optimization
  • AI model inference response time management
  • Data synchronization between local and cloud storage
  1. Security Measures
  • Data governance and sovereignty
  • Secure data transmission
  • Access control and authentication
  1. Infrastructure Management
  • Resource scaling strategy
  • Service availability monitoring
  • Disaster recovery planning

This architecture provides a framework for implementing document-based AI services securely and efficiently in enterprise environments. It is particularly suitable for organizations where data security and regulatory compliance are critical priorities. The design allows for gradual optimization based on actual usage patterns and performance requirements while maintaining a balance between security and functionality.

This solution effectively combines the benefits of on-premises security with cloud-based AI capabilities, making it an ideal choice for enterprises looking to implement advanced document analysis and conversation services while maintaining strict data control and compliance requirements.

Prediction & Detection

From Claude with some prompting
This image illustrates a Prediction and Detection system for time series data. Let me break down the key components:

  1. Left Large Box (Learning and Prediction Section):
  • Blue line: Actual Temperature data
  • Red dotted line: Predicted Temperature data
  • Uses time series prediction models like LSTM, ARIMA, and Prophet for learning
  1. Top Right (Threshold-based Anomaly Detection):
  • “Abnormal Detection with Threshold”
  • Detects abnormal temperature changes based on threshold values
  • The area marked with a red circle shows where values exceed the threshold
  • Includes “Warning” and “Critical” threshold levels
  1. Bottom Right (Pattern-based Anomaly Detection):
  • “Anomaly Detection with Predict-Pattern”
  • Compares predicted patterns with actual data to detect anomalies
  • The area marked with a green circle shows where actual data deviates from the predicted pattern

The system detects anomalies in two ways:

  1. When values exceed predetermined thresholds
  2. When actual data significantly deviates from predicted patterns

This type of system is particularly useful in:

  • Industrial monitoring
  • Equipment maintenance
  • Early warning systems
  • Quality control
  • System health monitoring

The combination of prediction and dual detection methods (threshold and pattern-based) provides a robust approach to identifying potential issues before they become critical problems.

ARIMA

From Claude with some prompting
The image depicts the Autoregressive Integrated Moving Average (ARIMA) Integrated Moving Average Model, which is a time series forecasting technique.

The main components are:

  1. AR (Autoregressive):
    • This component models the past pattern in the data.
    • It performs regression analysis on the historical data.
  2. I (Integrated):
    • This component handles the non-stationarity in the time series data.
    • It applies differencing to make the data stationary.
  3. MA (Moving Average):
    • This component uses the past error terms to calculate the current forecast.
    • It applies a moving average to the error terms.

The flow of the model is as follows:

  1. Past Pattern: The historical data patterns are analyzed.
  2. Regression: The past patterns are used to perform regression analysis.
  3. Difference: The non-stationary data is made stationary through differencing.
  4. Applying Weights + Sliding Window: The regression analysis and differencing are combined, with a sliding window used to update the model.
  5. Prediction: The model generates forecasts based on the previous steps.
  6. Stabilization: The forecasts are stabilized and smoothed.
  7. Remove error: The model removes any remaining error from the forecasts, bringing them closer to the true average.

The diagram also includes visual representations of the forecast output, showing both upward and downward trends.

Overall, this ARIMA model integrates autoregressive, differencing, and moving average components to provide accurate time series forecasts while handling non-stationarity in the data.

Entropy

From ChatGPT with some prompting
This image explains entropy growth from two perspectives: human and particle viewpoints.


1. Left (Human View: Ordered State)

  • Image: Dots tightly packed in a cube.
  • Human Perspective: A highly ordered state with low entropy, as dots are confined to specific positions.
  • Particle Perspective: Particles experience restrictions, resulting in a sense of disorder due to limited freedom.

2. Middle (Transition State)

  • Image: Dots spreading out.
  • Human Perspective: Increasing disorder as the system transitions to multiple possible states, leading to higher entropy.
  • Particle Perspective: Particles gain more freedom, moving toward their individual order.

3. Right (Human View: Disordered State)

  • Image: Dots randomly distributed.
  • Human Perspective: Maximum disorder, representing the highest entropy state.
  • Particle Perspective: Particles achieve their highest freedom, forming their unique “order” in randomness.

4. Entropy Growth (Human vs. Particle View)

  • Human Perspective: Order → Disorder (entropy increases).
  • Particle Perspective: Restrictions decrease, and particles transition from “disorder” to finding their own freedom and order.

This dual perspective illustrates entropy as both an increase in disorder (human view) and an emergence of particle freedom and order (particle view).