Personal with AI

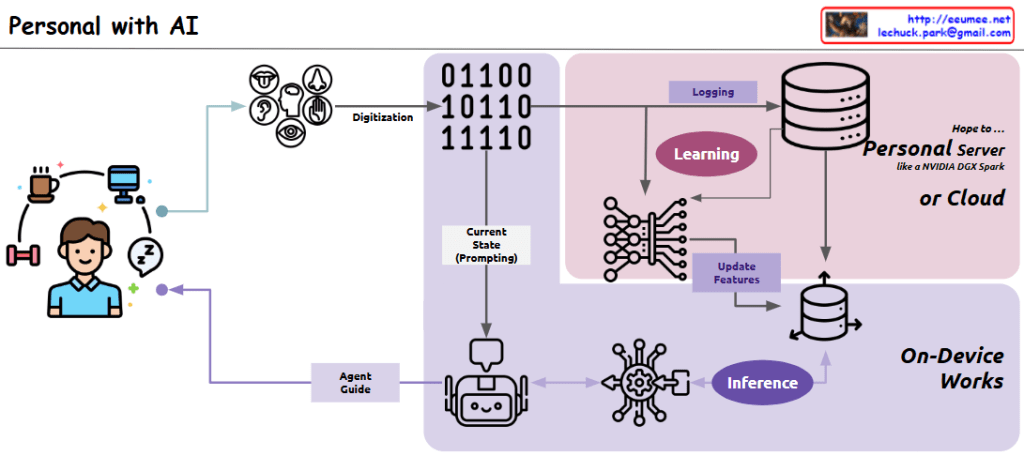
This diagram illustrates a “Personal Agent” system architecture that shows how everyday life is digitized to create an AI-based personal assistant:

Left side: The user’s daily activities (coffee, computer, exercise, sleep) are represented, which serve as the source for digitization.

Center-left: Various sensors (visual, auditory, tactile, olfactory, gustatory) capture the user’s daily activities and convert them through the “Digitization” process.

Center: The “Current State (Prompting)” component stores the digitized current state data, which is provided as prompting information to the AI agent.

Upper right (pink area): Two key processes take place:

  1. “Learning”: Processing user data from an ML/LLM perspective
  2. “Logging”: Continuously collecting data to update the vector database

This section runs on a “Personal Server or Cloud,” preferably using a personalized GPU server like NVIDIA DGX Spark, or alternatively in a cloud environment.

Lower right: In the “On-Device Works” area, the “Inference” process occurs. Based on current state data, the AI agent infers guidance needed for the user, and this process is handled directly on the user’s personal device.

Center bottom: The cute robot icon represents the AI agent, which provides personalized guidance to the user through the “Agent Guide” component.

Overall, this system has a cyclical structure that digitizes the user’s daily life, learns from that data to continuously update a personalized vector database, and uses the current state as a basis for the AI agent to provide customized guidance through an inference process that runs on-device.

with Claude

Data Explosion in Data Center

This image titled “Data Explosion in Data Center” illustrates three key challenges faced by modern data centers:

  1. Data/Computing:
    • Shows the explosive growth of data from computing servers to internet/cloud infrastructure and AI technologies.
    • Visualizes the exponential increase in data volume from 1X to 100X, 10,000X, and ultimately to 1,000,000,000X (one billion times).
    • Depicts how servers, computers, mobile devices, and global networks connect to massive data nodes, generating and processing enormous amounts of information.
  2. Power:
    • Addresses the increasing power supply requirements needed to support the data explosion in data centers.
    • Shows various energy sources including traditional power plants, wind turbines, solar panels, and battery storage systems to meet the growing energy demands.
    • Represents energy efficiency and sustainable power supply through a cyclical system indicated by green arrows.
  3. Cooling:
    • Illustrates the heat management challenges resulting from increased data processing and their solutions.
    • Explains the shift from traditional air cooling methods to more efficient server liquid cooling technologies.
    • Visualizes modern cooling solutions with blue circular arrows representing the cooling cycle.

This diagram comprehensively explains how the exponential growth of data impacts data center design and operations, particularly highlighting the challenges and innovations in power consumption and thermal management.

With Claude

DC growth

Data centers have expanded rapidly from the early days of cloud computing to the explosive growth driven by AI and ML.
Initially, growth was steady as enterprises moved to the cloud. However, with the rise of AI and ML, demand for powerful GPU-based computing has surged.
The global data center market, which grew at a CAGR of around 10% during the cloud era, is now accelerating to an estimated CAGR of 15–20% fueled by AI workloads.
This shift is marked by massive parallel processing with GPUs, transforming data centers into AI factories.

With ChatGPT

Analytical vs Empirical

Analytical vs Empirical Approaches

Analytical Approach

  1. Theory Driven: Based on mathematical theories and logical reasoning
  2. Programmable with Design: Implemented through explicit rules and algorithms
  3. Sequential by CPU: Tasks are processed one at a time in sequence
  4. Precise & Explainable: Results are accurate and decision-making processes are transparent

Empirical Approach

  1. Data Driven: Based on real data and observations
  2. Deep Learning with Learn: Neural networks automatically learn from data
  3. Parallel by GPU: Multiple tasks are processed simultaneously for improved efficiency
  4. Approximate & Unexplainable: Results are approximations and internal workings are difficult to explain

Summary

This diagram illustrates the key differences between traditional programming methods and modern machine learning approaches. The analytical approach follows clearly defined rules designed by humans and can precisely explain results, while the empirical approach learns patterns from data and improves efficiency through parallel processing but leaves decision-making processes as a black box.

with claude

Legacy AI (Rule-based)

The image shows a diagram explaining “Legacy AI” or rule-based AI systems. The diagram is structured in three main sections:

  1. At the top: A workflow showing three steps:
    • “Analysis” (illustrated with a document and magnifying glass with charts)
    • “Prioritize” (shown as a numbered list with 1-2-3 and an upward arrow)
    • “Choose the best” (depicted with a network diagram and pointing hand)
  2. In the middle: Programming conditional statement structure:
    • “IF [ ]” section contains analysis and prioritization icons, representing the condition evaluation
    • “THEN [ ]” section includes “optimal choice” icons, representing the action to execute when the condition is true
    • “It’s Rule” label on the right indicates this is a traditional program code processing approach
  3. At the bottom: A pipeline process labeled “It’s Algorithm (Rule-based AI)” showing:
    • A series of interconnected components with arrows
    • Each component contains small icons representing analysis and rules
    • The process ends with “Serialize without duplications”

This diagram effectively illustrates the structure and workflow of traditional rule-based AI systems, demonstrating how they operate like conventional programming with IF-THEN statements. The system first analyzes data, then prioritizes information based on predefined criteria, and finally makes decisions by selecting the optimal choice according to the programmed rules. This represents the foundation of early AI approaches before the advent of modern machine learning techniques, where explicit rules rather than learned patterns guided the decision-making process.

With Claude

AI Data Center : Power Req.

This image illustrates a diagram of power requirements and management for AI data centers:

Top Section – “More Power & Control”:

  • Diverse power sources: SMR (Small Modular Reactor), Reusable Energy (wind, solar), and ESS (Energy Storage System)
  • Power control system directing electricity from these various sources to the data center through “Power Control with Grid”
  • Integrated system for reliable and sustainable power supply

Bottom Section – “Optimization”:

  • Power distribution system through transformers and power supply units
  • Central control system for power routing
  • Load Balancing and Dynamic Power Management capabilities
  • Efficient power distribution to server racks based on GPU workload
  • “More Stable” indication emphasizing system reliability

This diagram highlights the importance of diversifying reliable power sources, efficient power control, and optimized power management according to GPU workload in AI data centers.

With Claude