From Claude with some prompting
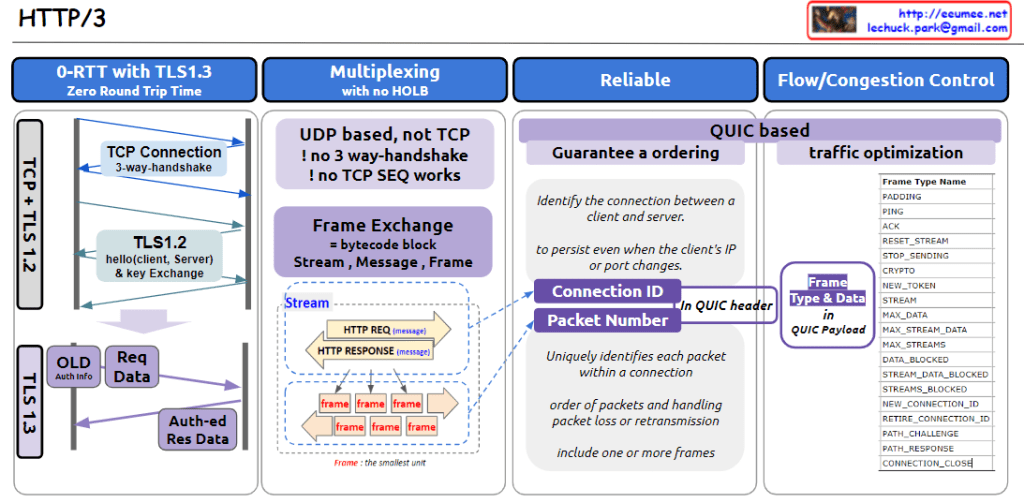
This image provides an overview of HTTP/3, highlighting its key features and components:
- 0-RTT with TLS1.3 (Zero Round Trip Time):
- Compares TLS 1.2 and 1.3 connection processes.
- TLS 1.3 offers faster handshake, reducing latency.
- Multiplexing with no HOLB (Head-of-Line Blocking):
- UDP-based, eliminating TCP’s 3-way handshake and TCP SEQ.
- Uses frame exchange, structured as streams, messages, and frames.
- Reliable:
- QUIC-based, ensuring reliable data transfer.
- Uses Connection ID to maintain connections despite client IP or port changes.
- Packet Number uniquely identifies each packet within a connection.
- Flow/Congestion Control:
- Lists various frame types for traffic optimization.
The diagram emphasizes that HTTP/3 is UDP-based and utilizes the QUIC protocol to enhance connection reliability and efficiency. It illustrates core concepts such as frame-based data exchange and the use of Connection IDs.
The image also details the QUIC header structure, explains how packet ordering and loss handling work, and provides a comprehensive list of frame types used in HTTP/3.
Overall, this diagram effectively visualizes the improvements HTTP/3 brings over its predecessors in terms of speed, reliability, and efficiency in data transfer.