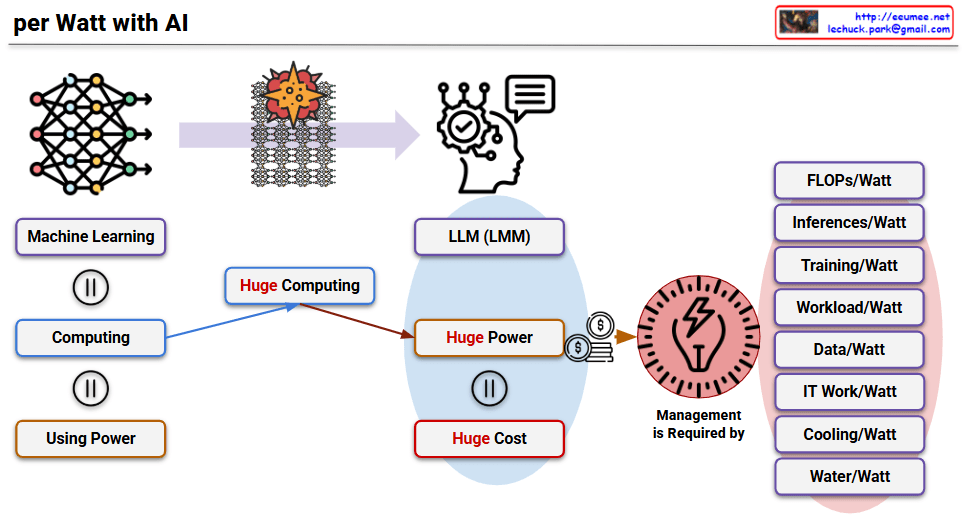
Machine Changes

This image titled “Machine Changes” visually illustrates the evolution of technology and machinery across different eras.

The diagram progresses from left to right with arrows showing the developmental stages:

Stage 1 (Left): Manual Labor Era

  • Tool icons (wrench, spanner)
  • Hand icon
  • Worker icon Representing basic manual work using simple tools.

Stage 2: Mechanization Era

  • Manufacturing equipment and machinery
  • Power-driven machines Depicting the industrial revolution period with mechanized production.

Stage 3 (Blue section): Automation and Computer Era

  • Power supply systems
  • CPU/processor chips
  • Computer systems
  • Programming code Representing automation through electronics and computer technology.

Stage 4 (Purple section): AI and Smart Technology Era

  • Robots
  • GPU processors
  • Artificial brain/AI
  • Interactive interfaces Representing modern smart technology integrated with artificial intelligence and robotics.

Additional Insight: The transition from the CPU era to the GPU era marks a fundamental shift in what drives technological capability. In the CPU era, program logic was the critical factor – the sophistication of algorithms and code determined system performance. However, in the GPU era, training data has become paramount – the quality, quantity, and diversity of data used to train AI models now determines the intelligence and effectiveness of these systems. This represents a shift from logic-driven computation to data-driven learning.

Overall, this infographic captures humanity’s technological evolution: Manual Labor → Mechanization → Automation → AI/Robotics, highlighting how the foundation of technological advancement has evolved from human skill to mechanical power to programmed logic to data-driven intelligence.

With Claude

Personal(User/Expert) Data Service

System Overview

The Personal Data Service is an open expert RAG service platform based on MCP (Model Context Protocol). This system creates a bidirectional ecosystem where both users and experts can benefit mutually, enhancing accessibility to specialized knowledge and improving AI service quality.

Core Components

1. User Interface (Left Side)

  • LLM Model Selection: Users can choose their preferred language model or MoE (Mixture of Experts)
  • Expert Selection: Select domain-specific experts for customized responses
  • Prompt Input: Enter specific questions or requests

2. Open MCP Platform (Center)

  • Integrated Management Hub: Connects and coordinates all system components
  • Request Processing: Matches user requests with appropriate expert RAG systems
  • Service Orchestration: Manages and optimizes the entire workflow

3. LLM Service Layer (Right Side)

  • Multi-LLM Support: Integration with various AI model services
  • OAuth Authentication: Direct user selection of paid/free services
  • Vendor Neutrality: Open architecture independent of specific AI services

4. Expert RAG Ecosystem (Bottom)

  • Specialized Data Registration: Building expert-specific knowledge databases through RAG
  • Quality Management System: Ensuring reliability through evaluation and reputation management
  • Historical Logs: Continuous quality improvement through service usage records

Key Features

  1. Bidirectional Ecosystem: Users obtain expert answers while experts monetize their knowledge
  2. Open Architecture: Scalable platform based on MCP standards
  3. Quality Assurance: Expert and answer quality management through evaluation systems
  4. Flexible Integration: Compatibility with various LLM services
  5. Autonomous Operation: Direct data management and updates by experts

With Claude

GPU Server Room : Changes

Image Overview

This dashboard displays the cascading resource changes that occur when GPU workload increases in an AI data center server room monitoring system.

Key Change Sequence (Estimated Values)

  1. GPU Load Increase: 30% → 90% (AI computation tasks initiated)
  2. Power Consumption Rise: 0.42kW → 1.26kW (3x increase)
  3. Temperature Delta Rise: 7°C → 17°C (increased heat generation)
  4. Cooling System Response:
    • Water flow rate: 200 LPM → 600 LPM (3x increase)
    • Fan speed: 600 RPM → 1200 RPM (2x increase)

Operational Prediction Implications

  • Operating Costs: Approximately 3x increase from baseline expected
  • Spare Capacity: 40% cooling system capacity remaining
  • Expansion Capability: Current setup can accommodate additional 67% GPU load

This AI data center monitoring dashboard illustrates the cascading resource changes when GPU workload increases from 30% to 90%, triggering proportional increases in power consumption (3x), cooling flow rate (3x), and fan speed (2x). The system demonstrates predictable operational scaling patterns, with current cooling capacity showing 40% remaining headroom for additional GPU load expansion. Note: All values are estimated figures for demonstration purposes.

Note: All numerical values are estimated figures for demonstration purposes and do not represent actual measured data.

With Claude

Human Vs AI

The moment AI surpasses humans will come only if the human brain is proven to be finite.
If every neural connection, every thought pattern, and every emotional process can be fully analyzed and translated into code, then AI, with its capacity to process and optimize those codes, can ultimately transcend human capability.
But if the human brain contains layers of complexity that are infinite or fundamentally unquantifiable, then no matter how advanced AI becomes, it will always fall short of complete understanding—and thus remain behind

“Encoder/Decoder” in a Transformer

Transformer Encoder-Decoder Architecture Explanation

This image is a diagram that visually explains the encoder-decoder structure of the Transformer model.

Encoder Section (Top, Green)

Purpose: Process “questions” by converting input text into vectors

Processing Steps:

  1. Tokenize input tokens and apply positional encoding
  2. Capture relationships between tokens using multi-head attention
  3. Extract meaning through feed-forward neural networks
  4. Stabilize with layer normalization

Decoder Section (Bottom, Purple)

Purpose: Generate new stories from text

Processing Steps:

  1. Apply positional encoding to output tokens
  2. Masked Multi-Head Self-Attention (Key Difference)
    • Mask future tokens using “Only Next” approach
    • Constraint for sequential generation
  3. Reference input information through encoder-decoder attention
  4. Apply feed-forward neural networks and layer normalization

Key Features

  • Encoder: Processes entire input at once to understand context
  • Decoder: References only previous tokens to sequentially generate new tokens
  • Attention Mechanism: Focuses on highly relevant parts for information processing

This is the core architecture used in various natural language processing tasks such as machine translation, text summarization, and question answering.

With Claude

Basic Power Operations

This image illustrates “Basic Power Operations,” showing the path and processes of electricity flowing from source to end-use.

The upper diagram includes the following key components from left to right:

  • Power Source/Intake – High voltage for efficient delivery with high warning
  • Transformer – Performs voltage step-down
  • Generator and Fuel Tank – Backup Power
  • Transformer #2 – Additional voltage step-down
  • UPS/Battery – 2nd Backup Power
  • PDU/TOB – Supplies power to the final servers

The diagram displays two backup power systems:

  • Backup power (Full outage) – Functions during complete power failures with backup time provided by Oil Tank with Generators
  • Backup Power (Partial outage) – Operates during partial outages with backup time provided by the Battery with UPSs

The simplified diagram at the bottom summarizes the complex power system into these fundamental elements:

  1. Source – Origin point of power
  2. Step-down – Voltage conversion
  3. Backup – Emergency power supply
  4. Use – Final power consumption

Throughout all stages of this process, two critical functions occur continuously:

  • Transmit – The ongoing process of transferring power that happens between and during all steps
  • Switching/Block – Control points distributed throughout the system that direct, regulate, or block power flow as needed

This demonstrates that seemingly complex power systems can be distilled into these essential concepts, with transmission and switching/blocking functioning as integral operations that connect and control all stages of the power delivery process.

WIth Claude