Mutual exclusion

From DALL-E with some prompting
this image illustrates the concept of ‘Mutex (Mutual exclusion)’ and ‘Critical Section’ which are pivotal in multi-threaded programming. Mutexes are used to control simultaneous data access by multiple threads, maintaining data consistency. A critical section is a part of the code that only one thread can access at a time, and it’s where sensitive data is processed. Threads gain access to this section by acquiring a mutex lock (pthread_mutex_lock), and after completing their work, they release the lock (pthread_mutex_unlock) to allow other threads to enter. This mechanism ensures that all threads view and maintain a consistent state of the data, allowing safe modifications and sustained data integrity.

Requires 4 Digitalizations

From DALL-E with some prompting
The image appears to be a flowchart or diagram explaining the requirements for digitalization. It starts on the left and moves to the right, outlining the transition from traditional facility-based operations to data service-based operations.

  • Facility-based Operation: On the top and bottom left, there are icons representing a computer and servers, symbolizing traditional facility-centric operations.
  • Operation Digitalization: In the center, there is a process that represents the transition of these facility-based operations to digitalization. It is labeled ‘Operation Digitalization’ and includes elements like data analysis and service development.
  • Data Service-based Operation: On the top right, icons representing modern data services like cloud computing illustrate the shift from facility-based to data-centric operations.

The bottom section includes the following detailed elements:

  • Enhancing Data Precision & Performance
  • Data Analysis System
  • DC Service Development
  • Data-based Operating

These elements are linked to the required experiences from traditional facilities (Facility Exp) and DC development (DevOps) as well as operational experience (DC Operation Exp). These components emphasize the various skills and experiences necessary for a digital transformation.

The overall diagram provides a high-level view of the different aspects of the digital transformation process, emphasizing that this transformation requires not only technical and operational capabilities but also a change in organizational experience and knowledge.

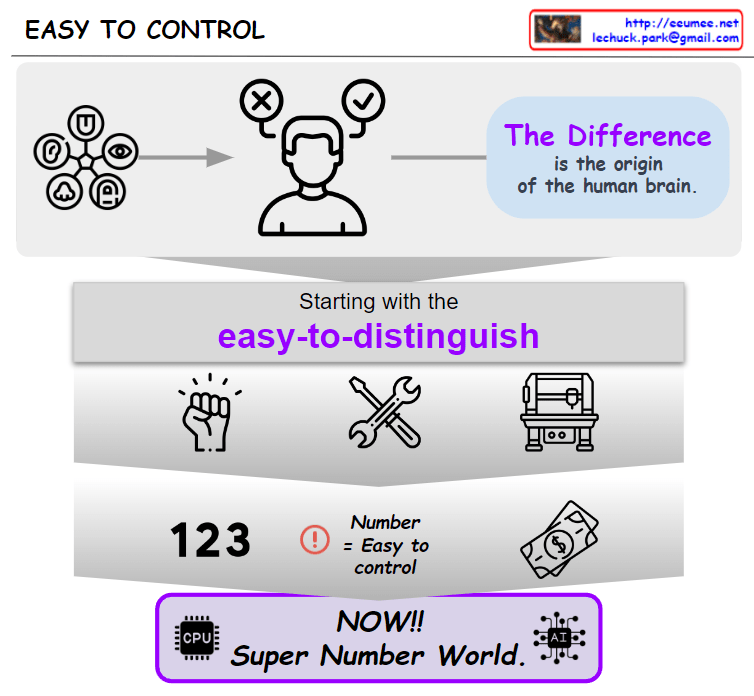
Human like “EASY TO CONTROL”

From DALL-E with some prompting
This image represents the connection between human discernment and numeric-based control systems. Humans possess the ability to detect and understand complex differences, which is crucial for the advancement of capital and business. Starting with simple and distinguishable elements, we have evolved to represent and control increasingly complex economic systems through numbers. The ‘Super Number World’ symbolically represents how we utilize technology, especially computing and artificial intelligence, to manage this complexity. Ultimately, the growth of capital and business is represented and understood through numbers, and controlling these numbers creates the most significant differences in the modern economy.

AI DC Operation

from DALL-E with some prompting
The image represents a diagram that outlines the transformation of data center operations through the integration of Artificial Intelligence (AI). The flow from left to right demonstrates the transition from traditional data center operations to a new paradigm facilitated by AI. The diagram begins with legacy operations characterized by machines, alarm systems, and the processes managed by experts.

The section titled ‘DC Growing’ highlights the expansion of data centers and the new challenges that arise, including hyperscale, increased complexity, and shifts in customer demographics from retail to major Cloud Service Providers (CSP).

In the subsequent ‘DT’ and ‘AI’ sections, the diagram showcases how Digital Transformation (DT) and AI are integrated into data center operations, enhancing service reliability, automation, energy optimization, and customer service. The ‘AI Accelerator’ section illustrates the role of AI in speeding up the operations of a data center, setting new benchmarks for AI-driven operations.

This diagram visually summarizes how data centers evolve with technological advancements and how AI and digital transformation technologies are revolutionizing traditional operational practices.

Software system

From DALL-E with some prompting
This image seems to describe the concept of a software system. It emphasizes that the system should not only operate mechanically but must also integrate and understand expert knowledge and human processes through digitalization.

At the top of the diagram, there are images of a computer labeled ‘Just System’ and an expert labeled ‘Expert,’ suggesting that traditionally, systems and human experts operate separately.

In the center, within a large framework labeled ‘Digitalization,’ the ‘System’ and ‘Expert’ are interconnected. This represents the need for systems to understand how machines and systems work and what is desired during the digitalization process.

At the bottom of the diagram, the phrase ‘It’s not just system. All works by systems. So, System must understand real works.’ highlights that the system is more than just mechanical operation; all work is done through systems, and therefore, the system must understand the actual work.

TTL(time to live) in ip packets

From DALL-E with some prompting
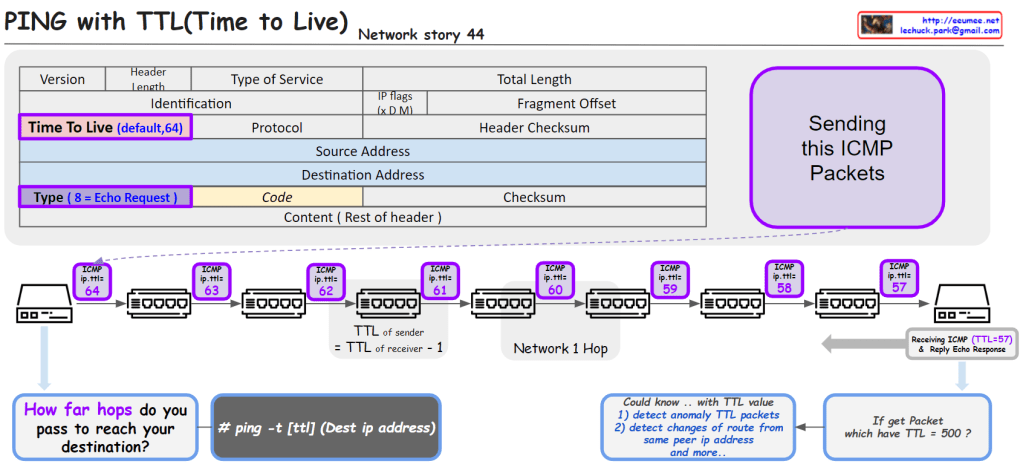
The image provides an educational visualization of how the “Time to Live” (TTL) value in the Internet Protocol (IP) is used to manage the life span of data packets during transmission. TTL is a crucial part of the IP header, which is decremented by each router the packet passes through. When the TTL value reaches zero, the packet is discarded, preventing it from circulating indefinitely.

The diagram outlines the following key points:

  1. ICMP Packets: It shows the process of sending ICMP (Internet Control Message Protocol) packets, specifically an Echo Request, which is a common method for pinging a destination IP address to test connectivity.
  2. TTL Decrement: Each hop in the network decreases the TTL value of the packet by one. This decrement process helps determine how many network hops the packet has passed through to reach its destination.
  3. TTL in Action: The sequence of routers illustrates the TTL value decreasing from 64 down to 57 as the packet travels across seven network hops.
  4. Command Usage: It includes a command line example # ping -t [ttl] (Dest ip address) that specifies how to ping with a defined TTL value.
  5. TTL Analysis: It suggests that analyzing TTL values can help detect anomalies in packets, changes of routes from the same peer IP address, among other uses. For example, receiving a packet with an unusually high TTL value like 500 could indicate an abnormality.
  6. Receiving and Responding: The final part of the image shows a receiving computer that gets the ICMP packet with a TTL of 57 and replies with an Echo Response.

This visual aid is likely used for educational purposes to teach about network packet management, routing, and network troubleshooting techniques.